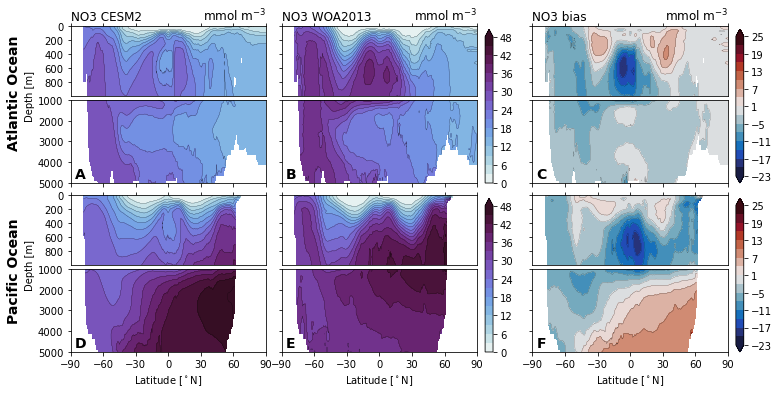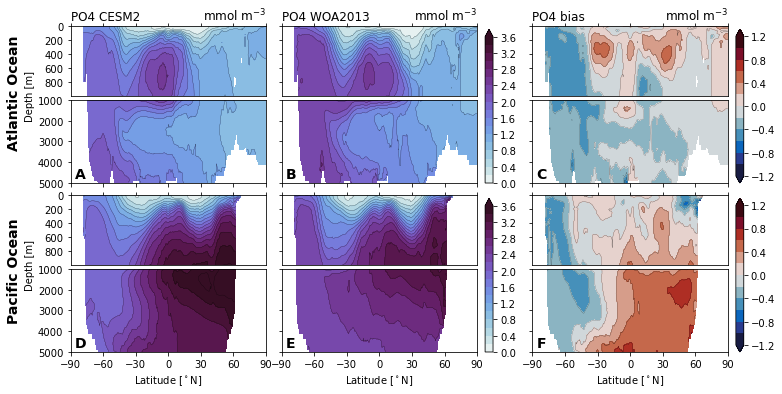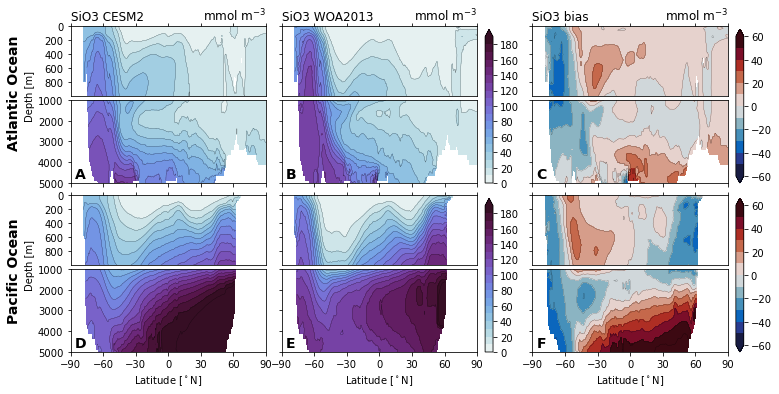
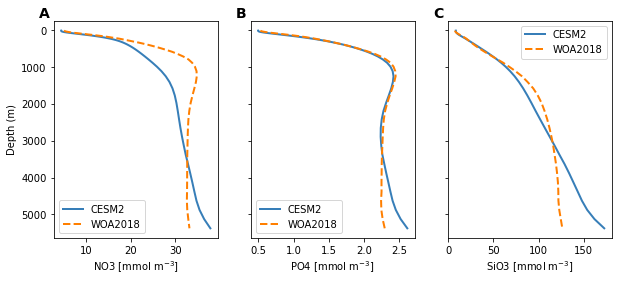
Nutrient Evaluation
Compare nutrient fields to observations from the World Ocean Atlas. Fields included here are:
NO3
PO4
SiO3
Imports
%matplotlib inline
import os

import numpy as np
import xarray as xr

import utils

import matplotlib.pyplot as plt
import matplotlib.gridspec as gridspec
import matplotlib.colors as colors

import cartopy
import cartopy.crs as ccrs
import cmocean

%load_ext watermark
%watermark -a "Mike Levy" -d -iv -m -g -h
Author: Mike Levy

Compiler    : GCC 9.3.0
OS          : Linux
Release     : 3.10.0-1127.18.2.el7.x86_64
Machine     : x86_64
Processor   : x86_64
CPU cores   : 72
Architecture: 64bit

Hostname: crhtc50

Git hash: 135f85d57e8712d47b21027021f8409ad12c469c

matplotlib: 3.4.2
cmocean   : 2.0
cartopy   : 0.19.0.post1
xarray    : 0.18.2
numpy     : 1.20.3
Read in the Data
nutrients = ['NO3', 'PO4', 'SiO3']
Read in the surface data
ds_surf_plot = xr.open_zarr('data/nutrients-surface-maps.zarr')
ds_surf_plot
<xarray.Dataset>
Dimensions:   (nlat: 384, nlon: 321)
Dimensions without coordinates: nlat, nlon
Data variables:
    NO3       (nlat, nlon) float32 dask.array<chunksize=(192, 321), meta=np.ndarray>
    NO3_obs   (nlat, nlon) float32 dask.array<chunksize=(192, 321), meta=np.ndarray>
    PO4       (nlat, nlon) float32 dask.array<chunksize=(192, 321), meta=np.ndarray>
    PO4_obs   (nlat, nlon) float32 dask.array<chunksize=(192, 321), meta=np.ndarray>
    SiO3      (nlat, nlon) float32 dask.array<chunksize=(192, 321), meta=np.ndarray>
    SiO3_obs  (nlat, nlon) float32 dask.array<chunksize=(192, 321), meta=np.ndarray>
    TLAT      (nlat, nlon) float64 dask.array<chunksize=(192, 161), meta=np.ndarray>
    TLONG     (nlat, nlon) float64 dask.array<chunksize=(192, 161), meta=np.ndarray>
xarray.Dataset
- nlat: 384
- nlon: 321
- NO3(nlat, nlon)float32dask.array<chunksize=(192, 321), meta=np.ndarray>
- long_name :
- NO3
- units :
- mmol m$^{-3}$
Array Chunk Bytes 481.50 kiB 240.75 kiB Shape (384, 321) (192, 321) Count 3 Tasks 2 Chunks Type float32 numpy.ndarray - NO3_obs(nlat, nlon)float32dask.array<chunksize=(192, 321), meta=np.ndarray>
- long_name :
- NO3
- units :
- mmol m$^{-3}$
Array Chunk Bytes 481.50 kiB 240.75 kiB Shape (384, 321) (192, 321) Count 3 Tasks 2 Chunks Type float32 numpy.ndarray - PO4(nlat, nlon)float32dask.array<chunksize=(192, 321), meta=np.ndarray>
- long_name :
- PO4
- units :
- mmol m$^{-3}$
Array Chunk Bytes 481.50 kiB 240.75 kiB Shape (384, 321) (192, 321) Count 3 Tasks 2 Chunks Type float32 numpy.ndarray - PO4_obs(nlat, nlon)float32dask.array<chunksize=(192, 321), meta=np.ndarray>
- long_name :
- PO4
- units :
- mmol m$^{-3}$
Array Chunk Bytes 481.50 kiB 240.75 kiB Shape (384, 321) (192, 321) Count 3 Tasks 2 Chunks Type float32 numpy.ndarray - SiO3(nlat, nlon)float32dask.array<chunksize=(192, 321), meta=np.ndarray>
- long_name :
- SiO3
- units :
- mmol m$^{-3}$
Array Chunk Bytes 481.50 kiB 240.75 kiB Shape (384, 321) (192, 321) Count 3 Tasks 2 Chunks Type float32 numpy.ndarray - SiO3_obs(nlat, nlon)float32dask.array<chunksize=(192, 321), meta=np.ndarray>
- long_name :
- SiO3
- units :
- mmol m$^{-3}$
Array Chunk Bytes 481.50 kiB 240.75 kiB Shape (384, 321) (192, 321) Count 3 Tasks 2 Chunks Type float32 numpy.ndarray - TLAT(nlat, nlon)float64dask.array<chunksize=(192, 161), meta=np.ndarray>
Array Chunk Bytes 0.94 MiB 241.50 kiB Shape (384, 321) (192, 161) Count 5 Tasks 4 Chunks Type float64 numpy.ndarray - TLONG(nlat, nlon)float64dask.array<chunksize=(192, 161), meta=np.ndarray>
Array Chunk Bytes 0.94 MiB 241.50 kiB Shape (384, 321) (192, 161) Count 5 Tasks 4 Chunks Type float64 numpy.ndarray
Read in zonal mean data
ds_zonal_mean = xr.open_zarr('data/nutrients-zonal-section.zarr').compute()
for v in nutrients:
    ds_zonal_mean[f'{v}_bias'] = ds_zonal_mean[v] - ds_zonal_mean[f'{v}_obs']

ds_zonal_mean = ds_zonal_mean.drop('basins').rename({'region': 'basins'})
ds_zonal_mean
<xarray.Dataset>
Dimensions:    (basins: 4, lat_t: 394, z_t: 60)
Coordinates:
  * lat_t      (lat_t) float32 -79.22 -78.69 -78.15 -77.62 ... 88.84 89.37 89.9
  * basins     (basins) <U14 'Global' 'Atlantic Ocean' ... 'Indian Ocean'
  * z_t        (z_t) float64 5.0 15.0 25.0 ... 4.875e+03 5.125e+03 5.375e+03
    z_t_       (z_t) float64 500.0 1.5e+03 2.5e+03 ... 5.125e+05 5.375e+05
Data variables:
    NO3        (basins, z_t, lat_t) float32 nan nan 19.02 19.07 ... nan nan nan
    NO3_obs    (basins, z_t, lat_t) float32 nan nan 20.99 21.69 ... nan nan nan
    PO4        (basins, z_t, lat_t) float32 nan nan 1.423 1.428 ... nan nan nan
    PO4_obs    (basins, z_t, lat_t) float32 nan nan 1.713 1.705 ... nan nan nan
    SiO3       (basins, z_t, lat_t) float32 nan nan 42.66 43.43 ... nan nan nan
    SiO3_obs   (basins, z_t, lat_t) float32 nan nan 61.78 62.55 ... nan nan nan
    NO3_bias   (basins, z_t, lat_t) float32 nan nan -1.967 ... nan nan nan
    PO4_bias   (basins, z_t, lat_t) float32 nan nan -0.2902 ... nan nan nan
    SiO3_bias  (basins, z_t, lat_t) float32 nan nan -19.12 ... nan nan nan
xarray.Dataset
- basins: 4
- lat_t: 394
- z_t: 60
- lat_t(lat_t)float32-79.22 -78.69 -78.15 ... 89.37 89.9
- edges :
- lat_t_edges
- long_name :
- Latitude Cell Centers
- units :
- degrees_north
array([-79.22052 , -78.68631 , -78.15209 , ..., 88.836334, 89.370575, 89.904816], dtype=float32) - basins(basins)<U14'Global' ... 'Indian Ocean'
array(['Global', 'Atlantic Ocean', 'Pacific Ocean', 'Indian Ocean'], dtype='<U14') - z_t(z_t)float645.0 15.0 ... 5.125e+03 5.375e+03
- long_name :
- depth from surface to midpoint of layer
- positive :
- down
- units :
- m
array([5.000000e+00, 1.500000e+01, 2.500000e+01, 3.500000e+01, 4.500000e+01, 5.500000e+01, 6.500000e+01, 7.500000e+01, 8.500000e+01, 9.500000e+01, 1.050000e+02, 1.150000e+02, 1.250000e+02, 1.350000e+02, 1.450000e+02, 1.550000e+02, 1.650984e+02, 1.754791e+02, 1.862913e+02, 1.976603e+02, 2.097114e+02, 2.225783e+02, 2.364088e+02, 2.513702e+02, 2.676542e+02, 2.854837e+02, 3.051192e+02, 3.268680e+02, 3.510935e+02, 3.782276e+02, 4.087847e+02, 4.433777e+02, 4.827367e+02, 5.277280e+02, 5.793729e+02, 6.388626e+02, 7.075633e+02, 7.870025e+02, 8.788252e+02, 9.847059e+02, 1.106204e+03, 1.244567e+03, 1.400497e+03, 1.573946e+03, 1.764003e+03, 1.968944e+03, 2.186457e+03, 2.413972e+03, 2.649001e+03, 2.889385e+03, 3.133405e+03, 3.379794e+03, 3.627670e+03, 3.876452e+03, 4.125768e+03, 4.375393e+03, 4.625190e+03, 4.875083e+03, 5.125028e+03, 5.375000e+03]) - z_t_(z_t)float64500.0 1.5e+03 ... 5.375e+05
array([5.00000000e+02, 1.50000000e+03, 2.50000000e+03, 3.50000000e+03,
       4.50000000e+03, 5.50000000e+03, 6.50000000e+03, 7.50000000e+03,
       8.50000000e+03, 9.50000000e+03, 1.05000000e+04, 1.15000000e+04,
       1.25000000e+04, 1.35000000e+04, 1.45000000e+04, 1.55000000e+04,
       1.65098398e+04, 1.75479043e+04, 1.86291270e+04, 1.97660273e+04,
       2.09711387e+04, 2.22578281e+04, 2.36408828e+04, 2.51370156e+04,
       2.67654199e+04, 2.85483652e+04, 3.05119219e+04, 3.26867988e+04,
       3.51093477e+04, 3.78227617e+04, 4.08784648e+04, 4.43377695e+04,
       4.82736719e+04, 5.27728008e+04, 5.79372891e+04, 6.38862617e+04,
       7.07563281e+04, 7.87002500e+04, 8.78825234e+04, 9.84705859e+04,
       1.10620422e+05, 1.24456688e+05, 1.40049719e+05, 1.57394641e+05,
       1.76400328e+05, 1.96894422e+05, 2.18645656e+05, 2.41397156e+05,
       2.64900125e+05, 2.88938469e+05, 3.13340469e+05, 3.37979344e+05,
       3.62767031e+05, 3.87645188e+05, 4.12576812e+05, 4.37539250e+05,
       4.62519031e+05, 4.87508344e+05, 5.12502812e+05, 5.37500000e+05])
- NO3(basins, z_t, lat_t)float32nan nan 19.02 19.07 ... nan nan nan
- cell_methods :
- time: mean
- grid_loc :
- 3111
- long_name :
- Dissolved Inorganic Nitrate
- units :
- mmol m$^{-3}$
array([[[ nan, nan, 19.019262 , ..., 3.127393 , 3.1124809, 3.0936654], [ nan, nan, 19.192722 , ..., 3.2082498, 3.1962583, 3.17934 ], [ nan, nan, 19.747913 , ..., 3.527372 , 3.5199492, 3.5046253], ..., [ nan, nan, nan, ..., nan, nan, nan], [ nan, nan, nan, ..., nan, nan, nan], [ nan, nan, nan, ..., nan, nan, nan]], [[ nan, nan, 21.196936 , ..., 3.127393 , 3.1124809, 3.0936654], [ nan, nan, 21.252968 , ..., 3.2082498, 3.1962583, 3.17934 ], [ nan, nan, 21.355429 , ..., 3.527372 , 3.5199492, 3.5046253], ... [ nan, nan, nan, ..., nan, nan, nan], [ nan, nan, nan, ..., nan, nan, nan], [ nan, nan, nan, ..., nan, nan, nan]], [[ nan, nan, nan, ..., nan, nan, nan], [ nan, nan, nan, ..., nan, nan, nan], [ nan, nan, nan, ..., nan, nan, nan], ..., [ nan, nan, nan, ..., nan, nan, nan], [ nan, nan, nan, ..., nan, nan, nan], [ nan, nan, nan, ..., nan, nan, nan]]], dtype=float32) - NO3_obs(basins, z_t, lat_t)float32nan nan 20.99 21.69 ... nan nan nan
- cell_methods :
- area: mean depth: mean time: mean within years time: mean over years
- grid_mapping :
- crs
- long_name :
- NO3
- src_file :
- /glade/work/mlevy/woa2018/1x1d/woa18_all_n00_01.nc
- src_file_varname :
- n_an
- standard_name :
- moles_concentration_of_nitrate_in_sea_water
- units :
- mmol m$^{-3}$
- wgtFile :
- /glade/work/mlevy/regrid/weight_files/latlon_1x1_180W_to_POP_gx1v7_bilinear_20180530.nc
array([[[ nan, nan, 20.986591 , ..., 0.98718345, 0.9528614 , 0.956563 ], [ nan, nan, 23.002188 , ..., 1.2074015 , 1.176309 , 1.1727661 ], [ nan, nan, 24.706089 , ..., 1.3017465 , 1.2707111 , 1.2656828 ], ..., [ nan, nan, nan, ..., nan, nan, nan], [ nan, nan, nan, ..., nan, nan, nan], [ nan, nan, nan, ..., nan, nan, nan]], [[ nan, nan, 22.391838 , ..., 0.98718345, 0.9528614 , 0.956563 ], [ nan, nan, 24.235825 , ..., 1.2074015 , 1.176309 , 1.1727661 ], [ nan, nan, 25.078253 , ..., 1.3017465 , 1.2707111 , 1.2656828 ], ... [ nan, nan, nan, ..., nan, nan, nan], [ nan, nan, nan, ..., nan, nan, nan], [ nan, nan, nan, ..., nan, nan, nan]], [[ nan, nan, nan, ..., nan, nan, nan], [ nan, nan, nan, ..., nan, nan, nan], [ nan, nan, nan, ..., nan, nan, nan], ..., [ nan, nan, nan, ..., nan, nan, nan], [ nan, nan, nan, ..., nan, nan, nan], [ nan, nan, nan, ..., nan, nan, nan]]], dtype=float32) - PO4(basins, z_t, lat_t)float32nan nan 1.423 1.428 ... nan nan nan
- cell_methods :
- time: mean
- grid_loc :
- 3111
- long_name :
- Dissolved Inorganic Phosphate
- units :
- mmol m$^{-3}$
array([[[ nan, nan, 1.4230961, ..., 0.9954035, 0.9968648, 0.9986534], [ nan, nan, 1.4344989, ..., 1.0013988, 1.0030755, 1.005006 ], [ nan, nan, 1.4741615, ..., 1.0225705, 1.0245651, 1.0266324], ..., [ nan, nan, nan, ..., nan, nan, nan], [ nan, nan, nan, ..., nan, nan, nan], [ nan, nan, nan, ..., nan, nan, nan]], [[ nan, nan, 1.5554473, ..., 0.9954035, 0.9968648, 0.9986534], [ nan, nan, 1.5587842, ..., 1.0013988, 1.0030755, 1.005006 ], [ nan, nan, 1.5648167, ..., 1.0225705, 1.0245651, 1.0266324], ... [ nan, nan, nan, ..., nan, nan, nan], [ nan, nan, nan, ..., nan, nan, nan], [ nan, nan, nan, ..., nan, nan, nan]], [[ nan, nan, nan, ..., nan, nan, nan], [ nan, nan, nan, ..., nan, nan, nan], [ nan, nan, nan, ..., nan, nan, nan], ..., [ nan, nan, nan, ..., nan, nan, nan], [ nan, nan, nan, ..., nan, nan, nan], [ nan, nan, nan, ..., nan, nan, nan]]], dtype=float32) - PO4_obs(basins, z_t, lat_t)float32nan nan 1.713 1.705 ... nan nan nan
- cell_methods :
- area: mean depth: mean time: mean within years time: mean over years
- grid_mapping :
- crs
- long_name :
- PO4
- src_file :
- /glade/work/mlevy/woa2018/1x1d/woa18_all_p00_01.nc
- src_file_varname :
- p_an
- standard_name :
- moles_concentration_of_phosphate_in_sea_water
- units :
- mmol m$^{-3}$
- wgtFile :
- /glade/work/mlevy/regrid/weight_files/latlon_1x1_180W_to_POP_gx1v7_bilinear_20180530.nc
array([[[ nan, nan, 1.7132827 , ..., 0.7824321 , 0.7851637 , 0.7851058 ], [ nan, nan, 1.8068694 , ..., 0.812785 , 0.81371224, 0.813248 ], [ nan, nan, 1.8792542 , ..., 0.75705147, 0.7578078 , 0.7565225 ], ..., [ nan, nan, nan, ..., nan, nan, nan], [ nan, nan, nan, ..., nan, nan, nan], [ nan, nan, nan, ..., nan, nan, nan]], [[ nan, nan, 1.7572992 , ..., 0.7824321 , 0.7851637 , 0.7851058 ], [ nan, nan, 1.8968039 , ..., 0.812785 , 0.81371224, 0.813248 ], [ nan, nan, 1.9512222 , ..., 0.75705147, 0.7578078 , 0.7565225 ], ... [ nan, nan, nan, ..., nan, nan, nan], [ nan, nan, nan, ..., nan, nan, nan], [ nan, nan, nan, ..., nan, nan, nan]], [[ nan, nan, nan, ..., nan, nan, nan], [ nan, nan, nan, ..., nan, nan, nan], [ nan, nan, nan, ..., nan, nan, nan], ..., [ nan, nan, nan, ..., nan, nan, nan], [ nan, nan, nan, ..., nan, nan, nan], [ nan, nan, nan, ..., nan, nan, nan]]], dtype=float32) - SiO3(basins, z_t, lat_t)float32nan nan 42.66 43.43 ... nan nan nan
- cell_methods :
- time: mean
- grid_loc :
- 3111
- long_name :
- Dissolved Inorganic Silicate
- units :
- mmol m$^{-3}$
array([[[ nan, nan, 42.659046 , ..., 7.488578 , 7.4984303, 7.523059 ], [ nan, nan, 42.93306 , ..., 7.5811567, 7.5947866, 7.621899 ], [ nan, nan, 43.63968 , ..., 7.896808 , 7.916356 , 7.9460306], ..., [ nan, nan, nan, ..., nan, nan, nan], [ nan, nan, nan, ..., nan, nan, nan], [ nan, nan, nan, ..., nan, nan, nan]], [[ nan, nan, 46.000652 , ..., 7.488578 , 7.4984303, 7.523059 ], [ nan, nan, 46.0551 , ..., 7.5811567, 7.5947866, 7.621899 ], [ nan, nan, 46.14845 , ..., 7.896808 , 7.916356 , 7.9460306], ... [ nan, nan, nan, ..., nan, nan, nan], [ nan, nan, nan, ..., nan, nan, nan], [ nan, nan, nan, ..., nan, nan, nan]], [[ nan, nan, nan, ..., nan, nan, nan], [ nan, nan, nan, ..., nan, nan, nan], [ nan, nan, nan, ..., nan, nan, nan], ..., [ nan, nan, nan, ..., nan, nan, nan], [ nan, nan, nan, ..., nan, nan, nan], [ nan, nan, nan, ..., nan, nan, nan]]], dtype=float32) - SiO3_obs(basins, z_t, lat_t)float32nan nan 61.78 62.55 ... nan nan nan
- cell_methods :
- area: mean depth: mean time: mean within years time: mean over years
- grid_mapping :
- crs
- long_name :
- SiO3
- src_file :
- /glade/work/mlevy/woa2018/1x1d/woa18_all_i00_01.nc
- src_file_varname :
- i_an
- standard_name :
- moles_concentration_of_silicate_in_sea_water
- units :
- mmol m$^{-3}$
- wgtFile :
- /glade/work/mlevy/regrid/weight_files/latlon_1x1_180W_to_POP_gx1v7_bilinear_20180530.nc
array([[[ nan, nan, 61.779434, ..., 10.102219, 10.192597, 10.225629], [ nan, nan, 63.352154, ..., 9.263759, 9.325229, 9.332197], [ nan, nan, 64.556366, ..., 9.001168, 9.07389 , 9.077654], ..., [ nan, nan, nan, ..., nan, nan, nan], [ nan, nan, nan, ..., nan, nan, nan], [ nan, nan, nan, ..., nan, nan, nan]], [[ nan, nan, 58.09269 , ..., 10.102219, 10.192597, 10.225629], [ nan, nan, 58.541718, ..., 9.263759, 9.325229, 9.332197], [ nan, nan, 60.34995 , ..., 9.001168, 9.07389 , 9.077654], ... [ nan, nan, nan, ..., nan, nan, nan], [ nan, nan, nan, ..., nan, nan, nan], [ nan, nan, nan, ..., nan, nan, nan]], [[ nan, nan, nan, ..., nan, nan, nan], [ nan, nan, nan, ..., nan, nan, nan], [ nan, nan, nan, ..., nan, nan, nan], ..., [ nan, nan, nan, ..., nan, nan, nan], [ nan, nan, nan, ..., nan, nan, nan], [ nan, nan, nan, ..., nan, nan, nan]]], dtype=float32) - NO3_bias(basins, z_t, lat_t)float32nan nan -1.967 ... nan nan nan
array([[[ nan, nan, -1.967329 , ..., 2.1402097, 2.1596193, 2.1371024], [ nan, nan, -3.8094654, ..., 2.0008483, 2.0199494, 2.0065737], [ nan, nan, -4.9581757, ..., 2.2256255, 2.249238 , 2.2389426], ..., [ nan, nan, nan, ..., nan, nan, nan], [ nan, nan, nan, ..., nan, nan, nan], [ nan, nan, nan, ..., nan, nan, nan]], [[ nan, nan, -1.1949024, ..., 2.1402097, 2.1596193, 2.1371024], [ nan, nan, -2.9828568, ..., 2.0008483, 2.0199494, 2.0065737], [ nan, nan, -3.722824 , ..., 2.2256255, 2.249238 , 2.2389426], ... [ nan, nan, nan, ..., nan, nan, nan], [ nan, nan, nan, ..., nan, nan, nan], [ nan, nan, nan, ..., nan, nan, nan]], [[ nan, nan, nan, ..., nan, nan, nan], [ nan, nan, nan, ..., nan, nan, nan], [ nan, nan, nan, ..., nan, nan, nan], ..., [ nan, nan, nan, ..., nan, nan, nan], [ nan, nan, nan, ..., nan, nan, nan], [ nan, nan, nan, ..., nan, nan, nan]]], dtype=float32) - PO4_bias(basins, z_t, lat_t)float32nan nan -0.2902 ... nan nan nan
array([[[ nan, nan, -0.29018664, ..., 0.21297145, 0.2117011 , 0.21354759], [ nan, nan, -0.37237048, ..., 0.18861377, 0.18936324, 0.19175798], [ nan, nan, -0.40509272, ..., 0.26551902, 0.2667573 , 0.27010995], ..., [ nan, nan, nan, ..., nan, nan, nan], [ nan, nan, nan, ..., nan, nan, nan], [ nan, nan, nan, ..., nan, nan, nan]], [[ nan, nan, -0.20185184, ..., 0.21297145, 0.2117011 , 0.21354759], [ nan, nan, -0.3380196 , ..., 0.18861377, 0.18936324, 0.19175798], [ nan, nan, -0.38640547, ..., 0.26551902, 0.2667573 , 0.27010995], ... [ nan, nan, nan, ..., nan, nan, nan], [ nan, nan, nan, ..., nan, nan, nan], [ nan, nan, nan, ..., nan, nan, nan]], [[ nan, nan, nan, ..., nan, nan, nan], [ nan, nan, nan, ..., nan, nan, nan], [ nan, nan, nan, ..., nan, nan, nan], ..., [ nan, nan, nan, ..., nan, nan, nan], [ nan, nan, nan, ..., nan, nan, nan], [ nan, nan, nan, ..., nan, nan, nan]]], dtype=float32) - SiO3_bias(basins, z_t, lat_t)float32nan nan -19.12 ... nan nan nan
array([[[        nan,         nan, -19.120388 , ...,  -2.6136408,
          -2.6941671,  -2.70257  ],
        [        nan,         nan, -20.419094 , ...,  -1.6826019,
          -1.730442 ,  -1.7102981],
        [        nan,         nan, -20.916687 , ...,  -1.1043601,
          -1.1575336,  -1.1316233],
        ...,
        [        nan,         nan,         nan, ...,         nan,
                 nan,         nan],
        [        nan,         nan,         nan, ...,         nan,
                 nan,         nan],
        [        nan,         nan,         nan, ...,         nan,
                 nan,         nan]],

       [[        nan,         nan, -12.092037 , ...,  -2.6136408,
          -2.6941671,  -2.70257  ],
        [        nan,         nan, -12.486618 , ...,  -1.6826019,
          -1.730442 ,  -1.7102981],
        [        nan,         nan, -14.2015   , ...,  -1.1043601,
          -1.1575336,  -1.1316233],
...
        [        nan,         nan,         nan, ...,         nan,
                 nan,         nan],
        [        nan,         nan,         nan, ...,         nan,
                 nan,         nan],
        [        nan,         nan,         nan, ...,         nan,
                 nan,         nan]],

       [[        nan,         nan,         nan, ...,         nan,
                 nan,         nan],
        [        nan,         nan,         nan, ...,         nan,
                 nan,         nan],
        [        nan,         nan,         nan, ...,         nan,
                 nan,         nan],
        ...,
        [        nan,         nan,         nan, ...,         nan,
                 nan,         nan],
        [        nan,         nan,         nan, ...,         nan,
                 nan,         nan],
        [        nan,         nan,         nan, ...,         nan,
                 nan,         nan]]], dtype=float32)
The last dataset is the global mean, with all vertical levels
glb_avg = xr.open_zarr('data/nutrients-global-profile.zarr')
glb_avg
<xarray.Dataset>
Dimensions:   (z_t: 60)
Coordinates:
  * z_t       (z_t) float64 5.0 15.0 25.0 35.0 ... 4.875e+03 5.125e+03 5.375e+03
Data variables:
    NO3       (z_t) float64 dask.array<chunksize=(60,), meta=np.ndarray>
    NO3_obs   (z_t) float64 dask.array<chunksize=(60,), meta=np.ndarray>
    PO4       (z_t) float64 dask.array<chunksize=(60,), meta=np.ndarray>
    PO4_obs   (z_t) float64 dask.array<chunksize=(60,), meta=np.ndarray>
    SiO3      (z_t) float64 dask.array<chunksize=(60,), meta=np.ndarray>
    SiO3_obs  (z_t) float64 dask.array<chunksize=(60,), meta=np.ndarray>
xarray.Dataset
- z_t: 60
- z_t(z_t)float645.0 15.0 ... 5.125e+03 5.375e+03
- long_name :
- Depth
- positive :
- down
- units :
- m
array([5.000000e+00, 1.500000e+01, 2.500000e+01, 3.500000e+01, 4.500000e+01,
       5.500000e+01, 6.500000e+01, 7.500000e+01, 8.500000e+01, 9.500000e+01,
       1.050000e+02, 1.150000e+02, 1.250000e+02, 1.350000e+02, 1.450000e+02,
       1.550000e+02, 1.650984e+02, 1.754790e+02, 1.862913e+02, 1.976603e+02,
       2.097114e+02, 2.225783e+02, 2.364088e+02, 2.513702e+02, 2.676542e+02,
       2.854837e+02, 3.051192e+02, 3.268680e+02, 3.510935e+02, 3.782276e+02,
       4.087846e+02, 4.433777e+02, 4.827367e+02, 5.277280e+02, 5.793729e+02,
       6.388626e+02, 7.075633e+02, 7.870025e+02, 8.788252e+02, 9.847059e+02,
       1.106204e+03, 1.244567e+03, 1.400497e+03, 1.573946e+03, 1.764003e+03,
       1.968944e+03, 2.186457e+03, 2.413972e+03, 2.649001e+03, 2.889385e+03,
       3.133405e+03, 3.379793e+03, 3.627670e+03, 3.876452e+03, 4.125768e+03,
       4.375392e+03, 4.625190e+03, 4.875083e+03, 5.125028e+03, 5.375000e+03])
- NO3(z_t)float64dask.array<chunksize=(60,), meta=np.ndarray>
- cell_methods :
- time: mean
- grid_loc :
- 3111
- long_name :
- NO3
- units :
- mmol m$^{-3}$
Array Chunk Bytes 480 B 480 B Shape (60,) (60,) Count 2 Tasks 1 Chunks Type float64 numpy.ndarray - NO3_obs(z_t)float64dask.array<chunksize=(60,), meta=np.ndarray>
- cell_methods :
- area: mean depth: mean time: mean within years time: mean over years
- grid_mapping :
- crs
- long_name :
- NO3
- src_file :
- /glade/work/mlevy/woa2018/1x1d/woa18_all_n00_01.nc
- src_file_varname :
- n_an
- standard_name :
- moles_concentration_of_nitrate_in_sea_water
- units :
- mmol m$^{-3}$
- wgtFile :
- /glade/work/mlevy/regrid/weight_files/latlon_1x1_180W_to_POP_gx1v7_bilinear_20180530.nc
Array Chunk Bytes 480 B 480 B Shape (60,) (60,) Count 2 Tasks 1 Chunks Type float64 numpy.ndarray - PO4(z_t)float64dask.array<chunksize=(60,), meta=np.ndarray>
- cell_methods :
- time: mean
- grid_loc :
- 3111
- long_name :
- PO4
- units :
- mmol m$^{-3}$
Array Chunk Bytes 480 B 480 B Shape (60,) (60,) Count 2 Tasks 1 Chunks Type float64 numpy.ndarray - PO4_obs(z_t)float64dask.array<chunksize=(60,), meta=np.ndarray>
- cell_methods :
- area: mean depth: mean time: mean within years time: mean over years
- grid_mapping :
- crs
- long_name :
- PO4
- src_file :
- /glade/work/mlevy/woa2018/1x1d/woa18_all_p00_01.nc
- src_file_varname :
- p_an
- standard_name :
- moles_concentration_of_phosphate_in_sea_water
- units :
- mmol m$^{-3}$
- wgtFile :
- /glade/work/mlevy/regrid/weight_files/latlon_1x1_180W_to_POP_gx1v7_bilinear_20180530.nc
Array Chunk Bytes 480 B 480 B Shape (60,) (60,) Count 2 Tasks 1 Chunks Type float64 numpy.ndarray - SiO3(z_t)float64dask.array<chunksize=(60,), meta=np.ndarray>
- cell_methods :
- time: mean
- grid_loc :
- 3111
- long_name :
- SiO3
- units :
- mmol m$^{-3}$
Array Chunk Bytes 480 B 480 B Shape (60,) (60,) Count 2 Tasks 1 Chunks Type float64 numpy.ndarray - SiO3_obs(z_t)float64dask.array<chunksize=(60,), meta=np.ndarray>
- cell_methods :
- area: mean depth: mean time: mean within years time: mean over years
- grid_mapping :
- crs
- long_name :
- SiO3
- src_file :
- /glade/work/mlevy/woa2018/1x1d/woa18_all_i00_01.nc
- src_file_varname :
- i_an
- standard_name :
- moles_concentration_of_silicate_in_sea_water
- units :
- mmol m$^{-3}$
- wgtFile :
- /glade/work/mlevy/regrid/weight_files/latlon_1x1_180W_to_POP_gx1v7_bilinear_20180530.nc
Array Chunk Bytes 480 B 480 B Shape (60,) (60,) Count 2 Tasks 1 Chunks Type float64 numpy.ndarray
Plot the Output
We set up helper functions/classes to help with plotting!
class contour_label_format(float):
    def __repr__(self):
        str = '%.1f' % (self.__float__(),)
        if str[-1] == '0':
            return '%.0f' % self.__float__()
        else:
            return '%.1f' % self.__float__()

def contour_label(cl):
    cl.levels = [contour_label_format(val) for val in cl.levels]
    fmt = '%r'
    return plt.clabel(cl, fontsize=5, inline=True, fmt=fmt)
cmap_field = cmocean.cm.dense
cmap_bias = cmocean.cm.balance

levels = dict(
    NO3=[0, 0.1, 0.2, 0.4, 0.6, 0.8, 1, 2, 4, 8, 12., 16, 20, 24, 28, 32,],
    PO4=[0, 0.02, 0.04, 0.08, 0.12, 0.16, 0.2, 0.3, 0.4, 0.5, 0.6, 0.8, 1.2, 1.4, 1.6, 1.8, 2.0],
    SiO3=[0, 1, 2, 3, 4, 5, 6, 7, 8, 9, 10, 15, 20, 25, 30, 35, 40, 45, 50, 60, 70, 80, 90,]
)

def mirror_levels(v, lmax):
    half = np.array(levels[v])[np.where(np.array(levels[v]) <= lmax)[0]]
    return np.concatenate((-half[:0:-1], half))

levels_bias = dict(
    NO3=np.arange(-12, 14, 2), #mirror_levels('NO3', 12),
    PO4=np.arange(-1., 1.15, 0.15), #mirror_levels('PO4', 1),
    SiO3=np.arange(-50, 55, 5), #mirror_levels('SiO3', 50),
)

contour_spec = dict(
    NO3=dict(
        levels=levels['NO3'],
        extend='max',
        cmap=cmap_field,
        norm=colors.BoundaryNorm(levels['NO3'], ncolors=cmap_field.N),
    ),
    NO3_bias=dict(
        levels=levels_bias['NO3'],
        extend='both',
        cmap=cmap_bias,
        norm=colors.BoundaryNorm(levels_bias['NO3'], ncolors=cmap_bias.N),
    ),
    PO4=dict(
        levels=levels['PO4'],
        extend='max',
        cmap=cmap_field,
        norm=colors.BoundaryNorm(levels['PO4'], ncolors=cmap_field.N),
    ),
    PO4_bias=dict(
        levels=levels_bias['PO4'], #
        extend='both',
        cmap=cmap_bias,
        norm=colors.BoundaryNorm(levels_bias['PO4'], ncolors=cmap_bias.N),
    ),
    SiO3=dict(
        levels=levels['SiO3'],
        extend='max',
        cmap=cmap_field,
        norm=colors.BoundaryNorm(levels['SiO3'], ncolors=256),
    ),
    SiO3_bias=dict(
        levels=levels_bias['SiO3'], #
        extend='both',
        cmap=cmap_bias,
        norm=colors.BoundaryNorm(levels_bias['SiO3'], ncolors=cmap_bias.N),
    ),

)
fig = plt.figure(figsize=(12, 8))
gs = gridspec.GridSpec(nrows=3, ncols=5, width_ratios=(1, 1, 0.02, 1, 0.02))

prj = ccrs.Robinson(central_longitude=305.0)

axs = []
maps = []
for i, nut in enumerate(['NO3', 'PO4', 'SiO3']):
    ax_m = plt.subplot(gs[i, 0], projection=prj)
    ax_o = plt.subplot(gs[i, 1], projection=prj)
    ax_b = plt.subplot(gs[i, 3], projection=prj)

    cax_field = plt.subplot(gs[i, 2])
    cax_bias = plt.subplot(gs[i, 4])

    axs.append((ax_m, ax_o, cax_field, ax_b, cax_bias))
    maps.extend([ax_m, ax_o, ax_b])

    cesm = ds_surf_plot[nut]
    obs = ds_surf_plot[f'{nut}_obs']
    bias = cesm - obs

    units = ds_surf_plot[nut].units


    cf_m = ax_m.contourf(
        ds_surf_plot.TLONG, ds_surf_plot.TLAT, cesm,
        **contour_spec[nut],
        transform=ccrs.PlateCarree(),
    )

    cl_m = ax_m.contour(
        ds_surf_plot.TLONG, ds_surf_plot.TLAT, cesm,
        levels=contour_spec[nut]['levels'], colors='k', linewidths=0.2,
        transform=ccrs.PlateCarree(),
    )
    #contour_label(cl_m)

    cf_o = ax_o.contourf(
        ds_surf_plot.TLONG, ds_surf_plot.TLAT, obs,
        **contour_spec[nut],
        transform=ccrs.PlateCarree(),
    )

    cl_o = ax_o.contour(
        ds_surf_plot.TLONG, ds_surf_plot.TLAT, obs,
        levels=contour_spec[nut]['levels'], colors='k', linewidths=0.2,
        transform=ccrs.PlateCarree(),
    )
    #contour_label(cl_o)

    cf_b = ax_b.contourf(
        ds_surf_plot.TLONG, ds_surf_plot.TLAT, bias,
        **contour_spec[f'{nut}_bias'],
        transform=ccrs.PlateCarree(),
    )

    cl_b = ax_b.contour(
        ds_surf_plot.TLONG, ds_surf_plot.TLAT, bias,
        levels=contour_spec[f'{nut}_bias']['levels'], colors='k', linewidths=0.2,
        transform=ccrs.PlateCarree(),
    )
    #contour_label(cl_b)

    for ax in [ax_m, ax_o, ax_b]:
        land = ax.add_feature(
            cartopy.feature.NaturalEarthFeature(
                'physical','land','110m',
                edgecolor='face',
                facecolor='gray'
            )
        )

    ax_m.set_title(f'{nut} CESM')
    ax_o.set_title(f'{nut} WOA2013')
    ax_b.set_title(f'{nut} bias')

    cb_field = plt.colorbar(cf_o, cax=cax_field, drawedges=True)
    cb_field.ax.set_title(units)
    cb_field.outline.set_linewidth(0.5)
    cb_field.dividers.set_linewidth(0.25)

    cb_bias = plt.colorbar(cf_b, cax=cax_bias, drawedges=True)
    cb_bias.ax.set_title(units)
    cb_bias.outline.set_linewidth(0.5)
    cb_bias.dividers.set_linewidth(0.25)

# add a gap between left two columns and right; scale colorbars
gs.update(left=0.05, right=0.95, hspace=0.05, wspace=0.05)
offset = 0.05
cax_vert_shrink = 0.8
for i in range(len(axs)):

    # the row of axis objects
    ax_m, ax_o, cax_field, ax_b, cax_bias = axs[i]

    # shift map
    p0 = ax_b.get_position()
    ax_b.set_position([p0.x0 + offset, p0.y0, p0.width, p0.height])

    # shift and scale colorbar
    p0 = cax_bias.get_position()
    shift_up = p0.height * (1. - cax_vert_shrink) / 2
    cax_bias.set_position([p0.x0 + offset, p0.y0 + shift_up, p0.width, p0.height * cax_vert_shrink])

    # scale colorbar
    p0 = cax_field.get_position()
    shift_up = p0.height * (1. - cax_vert_shrink) / 2
    cax_field.set_position([p0.x0, p0.y0 + shift_up, p0.width, p0.height * cax_vert_shrink])

utils.label_plots(fig, maps, xoff=0.02, yoff=0)

utils.savefig('nutrients-surface-maps.pdf')
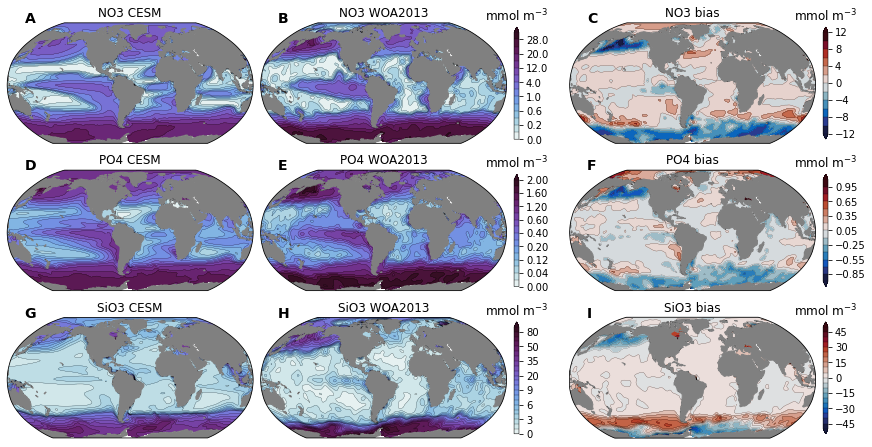
fig = plt.figure(figsize=(10, 4))

units = glb_avg.NO3.units

axs = []
for n, v in enumerate(nutrients):
    ax = fig.add_subplot(1, 3, n+1)
    axs.append(ax)

    ax.plot(glb_avg[v], glb_avg.z_t, '-', linewidth=2, color='#377eb8', label='CESM2')
    ax.plot(glb_avg[f'{v}_obs'], glb_avg.z_t, '--', linewidth=2, color='#ff7f00', label='WOA2018')

    ax.set(xlabel=f'{v} [{units}]')
    if n == 0:
        ax.set(ylabel='Depth (m)')
    else:
        ax.set_yticklabels([])
    plt.gca().invert_yaxis()
    ax.legend()

utils.label_plots(fig, axs, xoff=-0.02, yoff=0.01)
utils.savefig('nutrients-global-profiles.pdf')
levels = dict(
    NO3=np.arange(0, 51, 3),
    PO4=np.arange(0, 3.8, 0.2),
    SiO3=np.arange(0, 200, 10),
)


levels_bias = dict(
    NO3=np.arange(-23, 26, 3),
    PO4=np.arange(-1.2, 1.4, 0.2),
    SiO3=np.arange(-60, 70, 10),
)

contour_spec = dict(
    NO3=dict(
        levels=levels['NO3'],
        extend='max',
        cmap=cmap_field,
        norm=colors.BoundaryNorm(levels['NO3'], ncolors=cmap_field.N),
    ),
    NO3_bias=dict(
        levels=levels_bias['NO3'], #np.arange(-12, 14, 2),
        extend='both',
        cmap=cmap_bias,
        norm=colors.BoundaryNorm(levels_bias['NO3'], ncolors=cmap_bias.N),
    ),
    PO4=dict(
        levels=levels['PO4'],
        extend='max',
        cmap=cmap_field,
        norm=colors.BoundaryNorm(levels['PO4'], ncolors=cmap_field.N),
    ),
    PO4_bias=dict(
        levels=levels_bias['PO4'], #np.arange(-1., 1.15, 0.15),
        extend='both',
        cmap=cmap_bias,
        norm=colors.BoundaryNorm(levels_bias['PO4'], ncolors=cmap_bias.N),
    ),
    SiO3=dict(
        levels=levels['SiO3'],
        extend='max',
        cmap=cmap_field,
        norm=colors.BoundaryNorm(levels['SiO3'], ncolors=256),
    ),
    SiO3_bias=dict(
        levels=levels_bias['SiO3'], #np.arange(-50, 55, 5),
        extend='both',
        cmap=cmap_bias,
        norm=colors.BoundaryNorm(levels_bias['SiO3'], ncolors=cmap_bias.N),
    ),

)
contour_spec.update({f'{v}_obs': contour_spec[v] for v in nutrients})

plot_basins = ['Atlantic Ocean', 'Pacific Ocean']

gss = []

col_name = ['CESM2', 'WOA2013', 'bias']
for nutrient in nutrients:
    fig = plt.figure(figsize=(11, 6))
    gs = gridspec.GridSpec(2, 3)

    axs_surf = []
    axs_deep = []
    cfs_surf = []
    for row, basin in enumerate(plot_basins):

        axs_surf_row = []
        axs_deep_row = []
        cfs_surf_row = []
        for col, v in enumerate([nutrient, f'{nutrient}_obs', f'{nutrient}_bias']):
            gsi = gridspec.GridSpecFromSubplotSpec(100, 1, subplot_spec=gs[row, col])

            ax_surf = fig.add_subplot(gsi[:45, 0])
            ax_deep = fig.add_subplot(gsi[47:, 0])

            axs_surf_row.append(ax_surf)
            axs_deep_row.append(ax_deep)

            cf = ax_surf.contourf(
                ds_zonal_mean.lat_t, ds_zonal_mean.z_t,
                ds_zonal_mean[v].sel(basins=basin),
                **contour_spec[v]
            )
            cfs_surf_row.append(cf)

            ax_deep.contourf(
                ds_zonal_mean.lat_t, ds_zonal_mean.z_t,
                ds_zonal_mean[v].sel(basins=basin),
                **contour_spec[v]
            )

            ax_surf.contour(
                ds_zonal_mean.lat_t, ds_zonal_mean.z_t,
                ds_zonal_mean[v].sel(basins=basin),
                levels=contour_spec[v]['levels'], colors='k', linewidths=0.2,
            )

            ax_deep.contour(
                ds_zonal_mean.lat_t, ds_zonal_mean.z_t,
                ds_zonal_mean[v].sel(basins=basin),
                levels=contour_spec[v]['levels'], colors='k', linewidths=0.2,
            )


            ax_surf.set_ylim([1000., 0.])
            ax_surf.set_yticks(np.arange(0, 1000, 200))
            ax_surf.set_xticklabels([])
            ax_surf.xaxis.set_ticks_position('top')
            ax_surf.set_xticks(np.arange(-90, 110, 30))

            ax_deep.set_ylim([5000., 1000.])
            ax_deep.xaxis.set_ticks_position('bottom')
            ax_deep.set_xticks(np.arange(-90, 110, 30))

            if col == 0:
                ax_deep.set_ylabel('Depth [m]')
                ax_deep.yaxis.set_label_coords(-0.18, 1.05)
            else:
                ax_surf.set_yticklabels('')
                ax_deep.set_yticklabels('')

            if row == 1:
                ax_deep.set_xlabel('Latitude [$^\circ$N]')
            else:
                ax_surf.set_title(f'{nutrient} {col_name[col]}', loc='left')
                ax_surf.set_title('mmol m$^{-3}$', loc='right')
                ax_deep.set_xticklabels('')


        axs_surf.append(axs_surf_row)
        axs_deep.append(axs_deep_row)
        cfs_surf.append(cfs_surf_row)

    gs.update(left=0.11, right=0.89, wspace=0.08,hspace=0.075)

    #-- shift the right two columns over to make room for colorbar
    offset = 0.05
    for i in range(2):
        for j in range(2, 3):
            p0 = axs_surf[i][j].get_position()
            axs_surf[i][j].set_position([p0.x0+offset,p0.y0,p0.width,p0.height])

            p0 = axs_deep[i][j].get_position()
            axs_deep[i][j].set_position([p0.x0+offset,p0.y0,p0.width,p0.height])


    #-- add colorbars
    for i in range(2):
        for j in [1, 2]:
            p0 = axs_surf[i][j].get_position()
            p1 = axs_deep[i][j].get_position()

            cbaxes = fig.add_axes([p1.x0 + p1.width + 0.01,
                                   p1.y0 + 0.0,
                                   0.01,
                                   p0.height + p1.height - 0.0])
            cb = fig.colorbar(cfs_surf[i][j], cax=cbaxes)

    fig.text(0.03, 0.6, plot_basins[0],
             fontsize=14.,
             fontweight = 'semibold',rotation=90);

    fig.text(0.03, 0.2, plot_basins[1],
             fontsize=14.,
             fontweight = 'semibold',rotation=90);

    utils.label_plots(fig, [ax for ax_row in axs_deep for ax in ax_row] , xoff=0.005, yoff=-0.18)
    utils.savefig(f'nutrients-sections-{nutrient}.pdf')