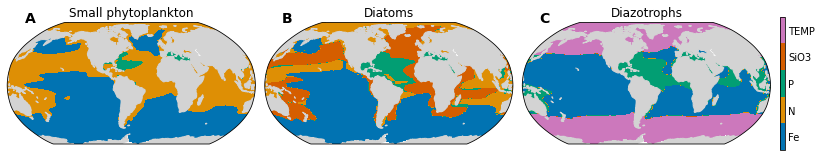
Nutrient Limitation
Compute biomass-weighted-mean limitation terms in the upper ocean (i.e., top 150 m).
Make 3 panel plot: maps of most limiting nutrient for each phytoplankton taxa (diatom, small phyto, diazotrophs).
Imports
%matplotlib inline
import os

import cftime

import xarray as xr
import numpy as np

import matplotlib.pyplot as plt
import matplotlib.gridspec as gridspec
import matplotlib.colors as colors
from matplotlib.colors import ListedColormap

import seaborn as sns

import cartopy
import cartopy.crs as ccrs

import intake
import intake_esm
import ann_avg_utils as aau

import ncar_jobqueue
from dask.distributed import Client

import xpersist as xp
# Set up xperist cache
cache_dir = os.path.join(os.path.sep, 'glade', 'p', 'cgd', 'oce', 'projects', 'cesm2-marbl', 'xpersist_cache')
if (os.path.isdir(cache_dir)):
    xp.settings['cache_dir'] = cache_dir
xp_dir = 'nutrient_limitation'
os.makedirs(os.path.join(xp.settings['cache_dir'], xp_dir), exist_ok=True)

import utils

# MCL: commenting this out, getting type error
#%load_ext watermark
#%watermark -a "Mike Levy" -d -iv -m -g -h
Spin up a Dask Cluster
cluster, client = utils.get_ClusterClient()
cluster.scale(12) #adapt(minimum_jobs=0, maximum_jobs=24)
client
/glade/u/home/mgrover/miniconda3/envs/cesm2-marbl/lib/python3.7/site-packages/distributed/node.py:164: UserWarning: Port 8787 is already in use.
Perhaps you already have a cluster running?
Hosting the HTTP server on port 33872 instead
  expected, actual
Client
|
Cluster
|
Setup and Apply the Calculation
global_vars = aau.global_vars()

exp = 'cesm2_hist'
time_slices = global_vars['time_slices']
experiment_dict = global_vars['experiment_dict']
%%time

temp_thres_diaz = 15.

def _get_all_limitation_vars(autotroph):
    catalog = intake.open_esm_datastore('data/campaign-cesm2-cmip6-timeseries.json',
                                        sep=':')

    darrays = []
    nutrient_dim = []
    for nutrient in nutrients:
        if (autotroph, nutrient) not in omit:
            if nutrient == 'TEMP':
                var = 'TEMP'
                da = catalog.search(
                        experiment=experiment_dict[exp][1],
                        variable=var
                    ).to_dataset_dict(
                        cdf_kwargs={'chunks':{'time' : 180}}
                    )['ocn:historical:pop.h'].drop(['ULAT', 'ULONG']).sel(
                        time=time_slices[exp],
                    ).isel(
                        z_t=0,
                        drop=True,
                    )[var].mean(['time', 'member_id'])

                da = xr.where(da > temp_thres_diaz, 1., 0.)
                darrays.append(da)
            else:
                var = f'{autotroph}_{nutrient}_lim_Cweight_avg_100m'
                print(f'Reading data for {var}')
                # Looking at historical run
                darrays.append(
                    catalog.search(
                        experiment=experiment_dict[exp][1],
                        variable=var
                    ).to_dataset_dict(
                        cdf_kwargs={'chunks':{'time' : 180}}
                    )['ocn:historical:pop.h'].drop(['ULAT', 'ULONG']).sel(
                        time=time_slices[exp]
                    )[var].mean(['time', 'member_id'])
                )
            variables.append(var)
            nutrient_dim.append(nutrient)
        else:
            print(f'Will not pair {autotroph} and {nutrient}')
    datasets = xr.concat([da.to_dataset(name=f'{autotroph}_lim') for da in darrays], dim='nutrient')
    datasets['nutrient'] = nutrient_dim

    return(datasets.compute())

variables = []
nutrients = ['P', 'Fe', 'N', 'SiO3', 'TEMP']
omit = [('sp', 'SiO3'), ('diaz', 'SiO3'), ('diaz', 'N'), ('sp', 'TEMP'), ('diat', 'TEMP')]
darrays = dict()
datasets = dict()
dsets_plot = dict()
for autotroph in ['sp', 'diat', 'diaz']:
    xp_func = xp.persist_ds(_get_all_limitation_vars, name=f'{xp_dir}/{autotroph}_lim', trust_cache=True)
    datasets[autotroph] = xp_func(autotroph)
    dsets_plot[autotroph] = utils.pop_add_cyclic(datasets[autotroph])
datasets
assuming cache is correct
reading cached file: /glade/p/cgd/oce/projects/cesm2-marbl/xpersist_cache/nutrient_limitation/sp_lim.nc
assuming cache is correct
reading cached file: /glade/p/cgd/oce/projects/cesm2-marbl/xpersist_cache/nutrient_limitation/diat_lim.nc
assuming cache is correct
reading cached file: /glade/p/cgd/oce/projects/cesm2-marbl/xpersist_cache/nutrient_limitation/diaz_lim.nc
CPU times: user 48.5 ms, sys: 14.4 ms, total: 62.9 ms
Wall time: 211 ms
{'sp': <xarray.Dataset>
 Dimensions:   (nlat: 384, nlon: 320, nutrient: 3)
 Coordinates:
     TLONG     (nlat, nlon) float64 320.6 321.7 322.8 323.9 ... 318.9 319.4 319.8
     TLAT      (nlat, nlon) float64 -79.22 -79.22 -79.22 ... 72.2 72.19 72.19
   * nutrient  (nutrient) object 'P' 'Fe' 'N'
 Dimensions without coordinates: nlat, nlon
 Data variables:
     sp_lim    (nutrient, nlat, nlon) float32 nan nan nan nan ... nan nan nan nan,
 'diat': <xarray.Dataset>
 Dimensions:   (nlat: 384, nlon: 320, nutrient: 4)
 Coordinates:
     TLONG     (nlat, nlon) float64 320.6 321.7 322.8 323.9 ... 318.9 319.4 319.8
     TLAT      (nlat, nlon) float64 -79.22 -79.22 -79.22 ... 72.2 72.19 72.19
   * nutrient  (nutrient) object 'P' 'Fe' 'N' 'SiO3'
 Dimensions without coordinates: nlat, nlon
 Data variables:
     diat_lim  (nutrient, nlat, nlon) float32 nan nan nan nan ... nan nan nan nan,
 'diaz': <xarray.Dataset>
 Dimensions:   (nlat: 384, nlon: 320, nutrient: 3)
 Coordinates:
     TLONG     (nlat, nlon) float64 320.6 321.7 322.8 323.9 ... 318.9 319.4 319.8
     TLAT      (nlat, nlon) float64 -79.22 -79.22 -79.22 ... 72.2 72.19 72.19
   * nutrient  (nutrient) object 'P' 'Fe' 'TEMP'
 Dimensions without coordinates: nlat, nlon
 Data variables:
     diaz_lim  (nutrient, nlat, nlon) float64 nan nan nan nan ... 0.0 0.0 0.0 0.0}
dsets_aligned = xr.align(*[ds for ds in dsets_plot.values()], join='outer', fill_value=100.)
dsets_plot = {k: ds for k, ds in zip(['sp', 'diat', 'diaz'], dsets_aligned)}
dsets_plot
{'sp': <xarray.Dataset>
 Dimensions:   (nlat: 384, nlon: 321, nutrient: 5)
 Coordinates:
   * nutrient  (nutrient) object 'Fe' 'N' 'P' 'SiO3' 'TEMP'
 Dimensions without coordinates: nlat, nlon
 Data variables:
     TLAT      (nlat, nlon) float64 -79.22 -79.22 -79.22 ... 80.31 80.31 80.31
     TLONG     (nlat, nlon) float64 -220.6 -219.4 -218.3 ... -39.29 -39.57 -39.86
     sp_lim    (nutrient, nlat, nlon) float32 nan nan nan ... 100.0 100.0 100.0,
 'diat': <xarray.Dataset>
 Dimensions:   (nlat: 384, nlon: 321, nutrient: 5)
 Coordinates:
   * nutrient  (nutrient) object 'Fe' 'N' 'P' 'SiO3' 'TEMP'
 Dimensions without coordinates: nlat, nlon
 Data variables:
     TLAT      (nlat, nlon) float64 -79.22 -79.22 -79.22 ... 80.31 80.31 80.31
     TLONG     (nlat, nlon) float64 -220.6 -219.4 -218.3 ... -39.29 -39.57 -39.86
     diat_lim  (nutrient, nlat, nlon) float32 nan nan nan ... 100.0 100.0 100.0,
 'diaz': <xarray.Dataset>
 Dimensions:   (nlat: 384, nlon: 321, nutrient: 5)
 Coordinates:
   * nutrient  (nutrient) object 'Fe' 'N' 'P' 'SiO3' 'TEMP'
 Dimensions without coordinates: nlat, nlon
 Data variables:
     TLAT      (nlat, nlon) float64 -79.22 -79.22 -79.22 ... 80.31 80.31 80.31
     TLONG     (nlat, nlon) float64 -220.6 -219.4 -218.3 ... -39.29 -39.57 -39.86
     diaz_lim  (nutrient, nlat, nlon) float64 nan nan nan nan ... 0.0 0.0 0.0 0.0}
Plot the Output Using Colorlblind Friendly Colors
current_palette = sns.color_palette('colorblind', 5)
cmap = ListedColormap(current_palette.as_hex())
sns.palplot(current_palette)

fig = plt.figure(figsize=(12,3.5))
gs = gridspec.GridSpec(nrows=1, ncols=4, width_ratios=(1, 1, 1, 0.02))

prj = ccrs.Robinson(central_longitude=305.0)

ocn_mask = np.where(np.isnan(dsets_plot['sp']['sp_lim'].isel(nutrient=0).data), False, True)
levels = np.arange(6)
norm = colors.BoundaryNorm(levels, ncolors=5)


current_palette = sns.color_palette('colorblind', 5)
cmap = ListedColormap(current_palette.as_hex())

autotroph_names = dict(
    sp='Small phytoplankton',
    diat='Diatoms',
    diaz='Diazotrophs',
)

maps = []
for n, autotroph in enumerate(['sp', 'diat', 'diaz']):
    ds = dsets_plot[autotroph]
    da = ds[f'{autotroph}_lim']
    ax = fig.add_subplot(gs[0, n], projection=prj)
    maps.append(ax)
    ax.set_title(autotroph_names[autotroph], fontsize=12)

    pc = ax.contourf(ds['TLONG'].data,
                     ds['TLAT'].data,
                     da.argmin(dim='nutrient', skipna=False).where(ocn_mask).data+0.5,
                     levels=levels,
                     norm=norm,
                     cmap=cmap,
                     transform=ccrs.PlateCarree())

    land = ax.add_feature(
        cartopy.feature.NaturalEarthFeature(
            'physical','land','110m',
            edgecolor='face',
            facecolor='lightgray'
        )
    )

# add colorbar
gs.update(left=0.05, right=0.95, hspace=0.05, wspace=0.05)
cax_vert_shrink = 0.7
cbar_ax = plt.subplot(gs[0, -1])
p0 = cbar_ax.get_position()
shift_up = p0.height * (1. - cax_vert_shrink) / 2
cbar_ax.set_position([p0.x0, p0.y0 + shift_up, p0.width, p0.height * cax_vert_shrink])

cbar = fig.colorbar(pc, cax=cbar_ax, ticks=levels+.5, orientation='vertical')

cbar.ax.set_yticklabels([f'{nutrient}' for nutrient in dsets_plot['sp'].nutrient.values]);
cbar.ax.tick_params(length=0);

utils.label_plots(fig, maps, xoff=0.02, yoff=0)
utils.savefig('nutrient-limitation-maps.pdf')