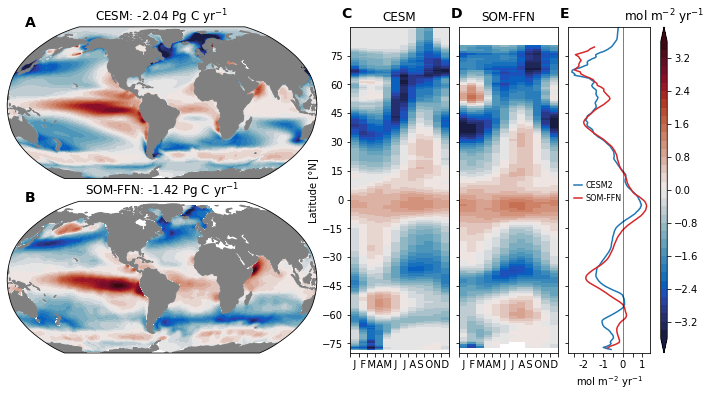
CO2 Flux
Compare monthly climatologies of the CO2 Flux with observations
Imports
%load_ext autoreload
%autoreload 2
%matplotlib inline
import os

from itertools import product

import pandas as pd
import numpy as np
import xarray as xr

import matplotlib.pyplot as plt
import matplotlib.gridspec as gridspec
import matplotlib.colors as colors
import cmocean

import cartopy
import cartopy.crs as ccrs

import xpersist as xp
cache_dir = '/glade/p/cgd/oce/projects/cesm2-marbl/xpersist_cache/3d_fields'
if (os.path.isdir(cache_dir)):
    xp.settings['cache_dir'] = cache_dir
os.makedirs(cache_dir, exist_ok=True)

import pop_tools


import climo_utils as cu
import utils
import discrete_obs

import plot
Spin up a Cluster
cluster, client = utils.get_ClusterClient()
cluster.scale(12) #adapt(minimum_jobs=0, maximum_jobs=24)
client
/glade/u/home/mgrover/miniconda3/envs/cesm2-marbl/lib/python3.7/site-packages/distributed/node.py:164: UserWarning: Port 8787 is already in use.
Perhaps you already have a cluster running?
Hosting the HTTP server on port 46185 instead
  expected, actual
Client
|
Cluster
|
Read in the Grid
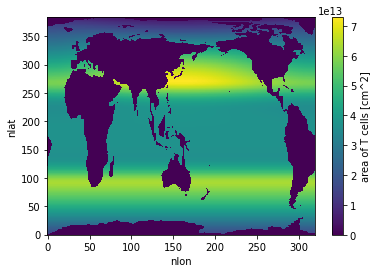
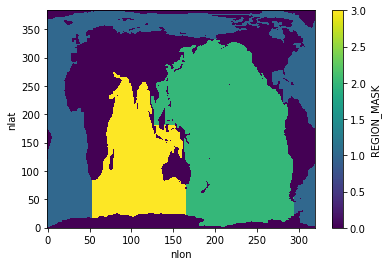
ds_grid = pop_tools.get_grid('POP_gx1v7')
masked_area = ds_grid.TAREA.where(ds_grid.REGION_MASK > 0).fillna(0.).expand_dims('region')
masked_area.plot()
<matplotlib.collections.QuadMesh at 0x2ba40310d250>
Compute Monthly Climatologies
def monthly_clim(ds):
    vars_time_dep = [v for v in ds.variables if 'time' in ds[v].dims]
    vars_other = list(set(ds.variables) - set(vars_time_dep))

    encoding = {v: ds[v].encoding for v in vars_time_dep}
    dso =  ds[vars_time_dep].groupby('time.month').mean('time').rename({'month': 'time'})
    for v in vars_time_dep:
        dso[v].encoding = encoding[v]
    return xr.merge([dso, ds[vars_other]])
nmolcm2s_to_molm2yr = 1e-9 * 1e4 * 86400. * 365.

time_slice = slice("1990-01-15", "2015-01-15")
varlist = [
    'FG_CO2',
]
ds_list = []
for variable in varlist:
    xp_func = xp.persist_ds(cu.read_CESM_var, name=f'co2-flux-{variable}', trust_cache=True,)
    ds_list.append(xp_func(
        time_slice,
        variable,
        postprocess=monthly_clim,
        mean_dims=['member_id'],
    ))

ds = xr.merge(ds_list)

#ds['TAREA'] = grid.TAREA

convert_glb = dict(
    FG_CO2=(-1.0) * 1e-9 * 86400. * 365. * 12e-15,
)

ds_glb = xr.Dataset()
for v in convert_glb.keys():
    ds_glb[v] = (masked_area * ds[v].mean('time')).sum(['nlat', 'nlon']) * convert_glb[v]
    ds_glb[v].attrs['units'] = 'Pg C yr$^{-1}$'


from netCDF4 import default_fillvals
ds.FG_CO2.data = ds.FG_CO2 * nmolcm2s_to_molm2yr * (-1.0) # reverse sign
ds.FG_CO2.attrs['units'] = 'mol m$^{-2}$ yr$^{-1}$'
ds.FG_CO2.encoding['coordinates'] = 'TLONG TLAT time'
ds.FG_CO2.encoding['_FillValue'] = default_fillvals['f4']
ds['time'] = ds.time.astype(np.int32)
ds
assuming cache is correct
reading cached file: /glade/p/cgd/oce/projects/cesm2-marbl/xpersist_cache/3d_fields/co2-flux-FG_CO2.nc
<xarray.Dataset>
Dimensions:      (nlat: 384, nlon: 320, time: 12, z_t: 60)
Coordinates:
    TLONG        (nlat, nlon) float64 ...
    TLAT         (nlat, nlon) float64 ...
    ULONG        (nlat, nlon) float64 ...
    ULAT         (nlat, nlon) float64 ...
  * time         (time) int32 1 2 3 4 5 6 7 8 9 10 11 12
  * z_t          (z_t) float32 500.0 1.5e+03 2.5e+03 ... 5.125e+05 5.375e+05
Dimensions without coordinates: nlat, nlon
Data variables:
    FG_CO2       (time, nlat, nlon) float32 nan nan nan nan ... nan nan nan nan
    TAREA        (nlat, nlon) float64 ...
    dz           (z_t) float32 1e+03 1e+03 1e+03 ... 2.499e+04 2.5e+04 2.5e+04
    KMT          (nlat, nlon) float64 ...
    REGION_MASK  (nlat, nlon) float64 ...
xarray.Dataset
- nlat: 384
- nlon: 320
- time: 12
- z_t: 60
- TLONG(nlat, nlon)float64...
- long_name :
- array of t-grid longitudes
- units :
- degrees_east
[122880 values with dtype=float64]
- TLAT(nlat, nlon)float64...
- long_name :
- array of t-grid latitudes
- units :
- degrees_north
[122880 values with dtype=float64]
- ULONG(nlat, nlon)float64...
- long_name :
- array of u-grid longitudes
- units :
- degrees_east
[122880 values with dtype=float64]
- ULAT(nlat, nlon)float64...
- long_name :
- array of u-grid latitudes
- units :
- degrees_north
[122880 values with dtype=float64]
- time(time)int321 2 3 4 5 6 7 8 9 10 11 12
array([ 1, 2, 3, 4, 5, 6, 7, 8, 9, 10, 11, 12], dtype=int32)
- z_t(z_t)float32500.0 1.5e+03 ... 5.375e+05
- long_name :
- depth from surface to midpoint of layer
- units :
- centimeters
- positive :
- down
- valid_min :
- 500.0
- valid_max :
- 537500.0
array([5.000000e+02, 1.500000e+03, 2.500000e+03, 3.500000e+03, 4.500000e+03,
       5.500000e+03, 6.500000e+03, 7.500000e+03, 8.500000e+03, 9.500000e+03,
       1.050000e+04, 1.150000e+04, 1.250000e+04, 1.350000e+04, 1.450000e+04,
       1.550000e+04, 1.650984e+04, 1.754790e+04, 1.862913e+04, 1.976603e+04,
       2.097114e+04, 2.225783e+04, 2.364088e+04, 2.513702e+04, 2.676542e+04,
       2.854837e+04, 3.051192e+04, 3.268680e+04, 3.510935e+04, 3.782276e+04,
       4.087846e+04, 4.433777e+04, 4.827367e+04, 5.277280e+04, 5.793729e+04,
       6.388626e+04, 7.075633e+04, 7.870025e+04, 8.788252e+04, 9.847059e+04,
       1.106204e+05, 1.244567e+05, 1.400497e+05, 1.573946e+05, 1.764003e+05,
       1.968944e+05, 2.186457e+05, 2.413972e+05, 2.649001e+05, 2.889385e+05,
       3.133405e+05, 3.379793e+05, 3.627670e+05, 3.876452e+05, 4.125768e+05,
       4.375392e+05, 4.625190e+05, 4.875083e+05, 5.125028e+05, 5.375000e+05],
      dtype=float32)
- FG_CO2(time, nlat, nlon)float32nan nan nan nan ... nan nan nan nan
- units :
- mol m$^{-2}$ yr$^{-1}$
array([[[ nan, nan, nan, ..., nan, nan, nan], [ nan, nan, nan, ..., nan, nan, nan], [-4.8583554e-04, -5.7094818e-04, -4.7134905e-04, ..., nan, nan, nan], ..., [ nan, nan, nan, ..., nan, nan, nan], [ nan, nan, nan, ..., nan, nan, nan], [ nan, nan, nan, ..., nan, nan, nan]], [[ nan, nan, nan, ..., nan, nan, nan], [ nan, nan, nan, ..., nan, nan, nan], [-3.4481292e-03, -4.1879923e-03, -3.5189423e-03, ..., nan, nan, nan], ... [ nan, nan, nan, ..., nan, nan, nan], [ nan, nan, nan, ..., nan, nan, nan], [ nan, nan, nan, ..., nan, nan, nan]], [[ nan, nan, nan, ..., nan, nan, nan], [ nan, nan, nan, ..., nan, nan, nan], [-6.2478946e-05, -7.6542361e-05, -6.9390946e-05, ..., nan, nan, nan], ..., [ nan, nan, nan, ..., nan, nan, nan], [ nan, nan, nan, ..., nan, nan, nan], [ nan, nan, nan, ..., nan, nan, nan]]], dtype=float32) - TAREA(nlat, nlon)float64...
- long_name :
- area of T cells
- units :
- centimeter^2
[122880 values with dtype=float64]
- dz(z_t)float32...
- long_name :
- thickness of layer k
- units :
- centimeters
array([ 1000. , 1000. , 1000. , 1000. , 1000. , 1000. , 1000. , 1000. , 1000. , 1000. , 1000. , 1000. , 1000. , 1000. , 1000. , 1000. , 1019.6808, 1056.4484, 1105.9951, 1167.807 , 1242.4133, 1330.9678, 1435.141 , 1557.1259, 1699.6796, 1866.2124, 2060.9023, 2288.852 , 2556.247 , 2870.575 , 3240.8372, 3677.7725, 4194.031 , 4804.2236, 5524.7544, 6373.192 , 7366.945 , 8520.893 , 9843.658 , 11332.466 , 12967.199 , 14705.344 , 16480.709 , 18209.135 , 19802.234 , 21185.957 , 22316.51 , 23186.494 , 23819.45 , 24257.217 , 24546.78 , 24731.014 , 24844.328 , 24911.975 , 24951.291 , 24973.594 , 24985.96 , 24992.674 , 24996.244 , 24998.11 ], dtype=float32) - KMT(nlat, nlon)float64...
- long_name :
- k Index of Deepest Grid Cell on T Grid
[122880 values with dtype=float64]
- REGION_MASK(nlat, nlon)float64...
- long_name :
- basin index number (signed integers)
[122880 values with dtype=float64]
ds_glb
<xarray.Dataset>
Dimensions:  (region: 1)
Dimensions without coordinates: region
Data variables:
    FG_CO2   (region) float64 -2.039
xarray.Dataset
- region: 1
- FG_CO2(region)float64-2.039
- units :
- Pg C yr$^{-1}$
array([-2.03923908])
After the computation is done, spin down the cluster
del client
del cluster
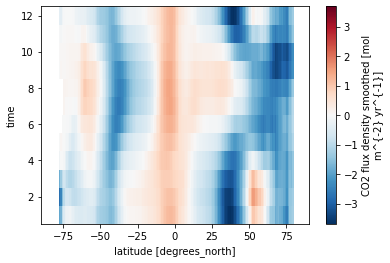
Open the Gridded Observational Data
with xr.open_dataset('/glade/p/cgd/oce/projects/cesm2-marbl/fgco2-MPI-SOM-FFN_POP_gx1v7.nc') as ds_obs:
    with xr.set_options(keep_attrs=True):
        ds_obs = monthly_clim(ds_obs.sel(time=slice('1990', '2014'))).load()

ds_obs_glb = (masked_area * ds_obs['fgco2_smoothed'].mean('time')).sum(['nlat', 'nlon']) * 12e-15 * 1e-4

import intake
cat = intake.open_catalog('catalogs/fgco2_MPI-SOM-FFN.yml')
with xr.set_options(keep_attrs=True):
    ds_tmp = monthly_clim(cat.fgco2_MPI_SOM_FFN().to_dask()[['fgco2_smoothed']].sel(time=slice('1990', '2014'))).compute()
    ds_obs_za = ds_tmp.mean('lon')

#for v in ['fgco2_smoothed', 'fgco2_raw']:
#     ds_obs[v].encoding['_FillValue'] = -1e36

#ds_obs['time'] = ds_obs.time.astype(np.int32)
ds_obs_glb
<xarray.DataArray (region: 1)>
array([-1.4174079])
Dimensions without coordinates: region
xarray.DataArray
- region: 1
- -1.417
array([-1.4174079])
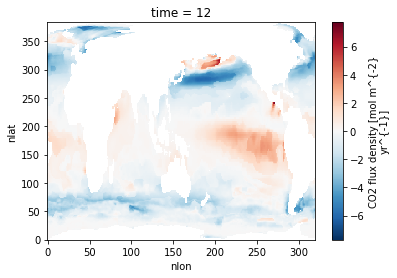
ds_obs.fgco2_raw.isel(time=-1).plot() #('time').plot()
<matplotlib.collections.QuadMesh at 0x2ba403c909d0>
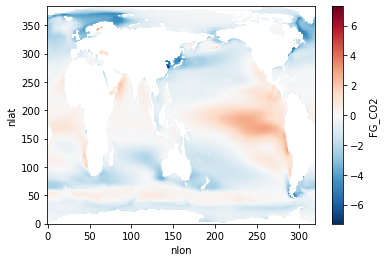
ds.FG_CO2.mean('time').plot()
<matplotlib.collections.QuadMesh at 0x2ba52a1c15d0>
mask2d = utils.get_pop_region_mask_za(mask_type='2D')
mask2d.plot()
<matplotlib.collections.QuadMesh at 0x2ba52a2d5a90>
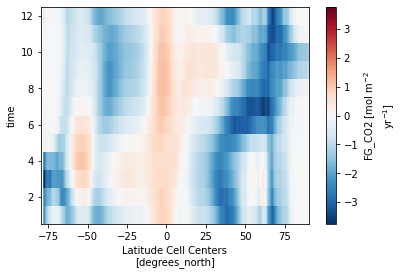
Compute the Zonal Mean
#
ds_za = utils.zonal_mean_via_fortran(ds, grid='POP_gx1v7', region_mask=mask2d,)
ds_za
za ran successfully, writing netcdf output
<xarray.Dataset>
Dimensions:      (basins: 4, lat_t: 394, lat_t_edges: 395, time: 12)
Coordinates:
  * lat_t        (lat_t) float32 -79.22 -78.69 -78.15 ... 88.84 89.37 89.9
  * lat_t_edges  (lat_t_edges) float32 -79.49 -78.95 -78.42 ... 89.1 89.64 90.0
  * time         (time) int32 1 2 3 4 5 6 7 8 9 10 11 12
Dimensions without coordinates: basins
Data variables:
    FG_CO2       (basins, time, lat_t) float32 nan nan -1.236 ... nan nan nan
xarray.Dataset
- basins: 4
- lat_t: 394
- lat_t_edges: 395
- time: 12
- lat_t(lat_t)float32-79.22 -78.69 -78.15 ... 89.37 89.9
- long_name :
- Latitude Cell Centers
- units :
- degrees_north
- edges :
- lat_t_edges
array([-79.22052 , -78.68631 , -78.15209 , ..., 88.836334, 89.370575, 89.904816], dtype=float32) - lat_t_edges(lat_t_edges)float32-79.49 -78.95 -78.42 ... 89.64 90.0
array([-79.48714 , -78.952896, -78.418655, ..., 89.103455, 89.637695, 90. ], dtype=float32) - time(time)int321 2 3 4 5 6 7 8 9 10 11 12
array([ 1, 2, 3, 4, 5, 6, 7, 8, 9, 10, 11, 12], dtype=int32)
- FG_CO2(basins, time, lat_t)float32...
- units :
- mol m$^{-2}$ yr$^{-1}$
array([[[      nan,       nan, ..., -0.00894 , -0.008547],
        [      nan,       nan, ..., -0.014722, -0.01433 ],
        ...,
        [      nan,       nan, ..., -0.067452, -0.064322],
        [      nan,       nan, ..., -0.006892, -0.006435]],

       [[      nan,       nan, ..., -0.00894 , -0.008547],
        [      nan,       nan, ..., -0.014722, -0.01433 ],
        ...,
        [      nan,       nan, ..., -0.067452, -0.064322],
        [      nan,       nan, ..., -0.006892, -0.006435]],

       [[      nan,       nan, ...,       nan,       nan],
        [      nan,       nan, ...,       nan,       nan],
        ...,
        [      nan,       nan, ...,       nan,       nan],
        [      nan,       nan, ...,       nan,       nan]],

       [[      nan,       nan, ...,       nan,       nan],
        [      nan,       nan, ...,       nan,       nan],
        ...,
        [      nan,       nan, ...,       nan,       nan],
        [      nan,       nan, ...,       nan,       nan]]], dtype=float32)
Plot the Results
ds_za.FG_CO2.isel(basins=0).plot()
<matplotlib.collections.QuadMesh at 0x2ba52a44f5d0>
ds_obs_za.fgco2_smoothed.plot()
<matplotlib.collections.QuadMesh at 0x2ba52a5eae90>
dsa = ds.mean('time').rename({'FG_CO2': 'fgco2'})
dsa['fgco2_obs'] = ds_obs.fgco2_smoothed.mean('time')
dsa = utils.pop_add_cyclic(dsa)
dsa
<xarray.Dataset>
Dimensions:      (nlat: 384, nlon: 321, z_t: 60)
Coordinates:
  * z_t          (z_t) float32 500.0 1.5e+03 2.5e+03 ... 5.125e+05 5.375e+05
Dimensions without coordinates: nlat, nlon
Data variables:
    TLAT         (nlat, nlon) float64 -79.22 -79.22 -79.22 ... 80.31 80.31 80.31
    TLONG        (nlat, nlon) float64 -220.6 -219.4 -218.3 ... -39.57 -39.86
    fgco2        (nlat, nlon) float32 nan nan nan nan nan ... nan nan nan nan
    TAREA        (nlat, nlon) float64 8.592e+12 8.592e+12 ... 3.341e+12
    dz           (z_t) float32 1e+03 1e+03 1e+03 ... 2.499e+04 2.5e+04 2.5e+04
    KMT          (nlat, nlon) float64 0.0 0.0 0.0 0.0 0.0 ... 0.0 0.0 0.0 0.0
    REGION_MASK  (nlat, nlon) float64 0.0 0.0 0.0 0.0 0.0 ... 0.0 0.0 0.0 0.0
    fgco2_obs    (nlat, nlon) float64 nan nan nan nan nan ... nan nan nan nan
xarray.Dataset
- nlat: 384
- nlon: 321
- z_t: 60
- z_t(z_t)float32500.0 1.5e+03 ... 5.375e+05
- long_name :
- depth from surface to midpoint of layer
- units :
- centimeters
- positive :
- down
- valid_min :
- 500.0
- valid_max :
- 537500.0
array([5.000000e+02, 1.500000e+03, 2.500000e+03, 3.500000e+03, 4.500000e+03,
       5.500000e+03, 6.500000e+03, 7.500000e+03, 8.500000e+03, 9.500000e+03,
       1.050000e+04, 1.150000e+04, 1.250000e+04, 1.350000e+04, 1.450000e+04,
       1.550000e+04, 1.650984e+04, 1.754790e+04, 1.862913e+04, 1.976603e+04,
       2.097114e+04, 2.225783e+04, 2.364088e+04, 2.513702e+04, 2.676542e+04,
       2.854837e+04, 3.051192e+04, 3.268680e+04, 3.510935e+04, 3.782276e+04,
       4.087846e+04, 4.433777e+04, 4.827367e+04, 5.277280e+04, 5.793729e+04,
       6.388626e+04, 7.075633e+04, 7.870025e+04, 8.788252e+04, 9.847059e+04,
       1.106204e+05, 1.244567e+05, 1.400497e+05, 1.573946e+05, 1.764003e+05,
       1.968944e+05, 2.186457e+05, 2.413972e+05, 2.649001e+05, 2.889385e+05,
       3.133405e+05, 3.379793e+05, 3.627670e+05, 3.876452e+05, 4.125768e+05,
       4.375392e+05, 4.625190e+05, 4.875083e+05, 5.125028e+05, 5.375000e+05],
      dtype=float32)
- TLAT(nlat, nlon)float64-79.22 -79.22 ... 80.31 80.31
array([[-79.22052261, -79.22052261, -79.22052261, ..., -79.22052261, -79.22052261, -79.22052261], [-78.68630626, -78.68630626, -78.68630626, ..., -78.68630626, -78.68630626, -78.68630626], [-78.15208992, -78.15208992, -78.15208992, ..., -78.15208992, -78.15208992, -78.15208992], ..., [ 81.44584238, 81.44584238, 81.44466079, ..., 81.44229771, 81.44466079, 81.44584238], [ 80.87803543, 80.87803543, 80.87705778, ..., 80.87510244, 80.87705778, 80.87803543], [ 80.31321311, 80.31321311, 80.31241206, ..., 80.31080987, 80.31241206, 80.31321311]]) - TLONG(nlat, nlon)float64-220.6 -219.4 ... -39.57 -39.86
array([[-220.56249613, -219.43749609, -218.31249606, ..., 137.18750382, 138.31250385, 139.43750388], [-220.56249613, -219.43749609, -218.31249606, ..., 137.18750382, 138.31250385, 139.43750388], [-220.56249613, -219.43749609, -218.31249606, ..., 137.18750382, 138.31250385, 139.43750388], ..., [ -39.7932723 , -40.20670806, -40.62006565, ..., -38.96679888, -39.37991654, -39.79327229], [ -39.82753619, -40.17244447, -40.51730173, ..., -39.13798089, -39.48268046, -39.82753618], [ -39.85740526, -40.14257567, -40.42771349, ..., -39.28723255, -39.5722687 , -39.85740525]]) - fgco2(nlat, nlon)float32nan nan nan nan ... nan nan nan nan
array([[nan, nan, nan, ..., nan, nan, nan], [nan, nan, nan, ..., nan, nan, nan], [nan, nan, nan, ..., nan, nan, nan], ..., [nan, nan, nan, ..., nan, nan, nan], [nan, nan, nan, ..., nan, nan, nan], [nan, nan, nan, ..., nan, nan, nan]], dtype=float32) - TAREA(nlat, nlon)float648.592e+12 8.592e+12 ... 3.341e+12
array([[8.59217065e+12, 8.59217065e+12, 8.59235345e+12, ..., 8.59271911e+12, 8.59235345e+12, 8.59217065e+12], [1.45745047e+13, 1.45745047e+13, 1.45745047e+13, ..., 1.45745047e+13, 1.45745047e+13, 1.45745047e+13], [1.52530781e+13, 1.52530781e+13, 1.52530781e+13, ..., 1.52530781e+13, 1.52530781e+13, 1.52530781e+13], ..., [4.32754786e+12, 4.32754786e+12, 4.32799292e+12, ..., 4.32888316e+12, 4.32799292e+12, 4.32754786e+12], [3.82798578e+12, 3.82798578e+12, 3.82839189e+12, ..., 3.82920421e+12, 3.82839189e+12, 3.82798578e+12], [3.34119240e+12, 3.34119240e+12, 3.34155788e+12, ..., 3.34228893e+12, 3.34155788e+12, 3.34119240e+12]]) - dz(z_t)float321e+03 1e+03 ... 2.5e+04 2.5e+04
array([ 1000. , 1000. , 1000. , 1000. , 1000. , 1000. , 1000. , 1000. , 1000. , 1000. , 1000. , 1000. , 1000. , 1000. , 1000. , 1000. , 1019.6808, 1056.4484, 1105.9951, 1167.807 , 1242.4133, 1330.9678, 1435.141 , 1557.1259, 1699.6796, 1866.2124, 2060.9023, 2288.852 , 2556.247 , 2870.575 , 3240.8372, 3677.7725, 4194.031 , 4804.2236, 5524.7544, 6373.192 , 7366.945 , 8520.893 , 9843.658 , 11332.466 , 12967.199 , 14705.344 , 16480.709 , 18209.135 , 19802.234 , 21185.957 , 22316.51 , 23186.494 , 23819.45 , 24257.217 , 24546.78 , 24731.014 , 24844.328 , 24911.975 , 24951.291 , 24973.594 , 24985.96 , 24992.674 , 24996.244 , 24998.11 ], dtype=float32) - KMT(nlat, nlon)float640.0 0.0 0.0 0.0 ... 0.0 0.0 0.0 0.0
array([[0., 0., 0., ..., 0., 0., 0.], [0., 0., 0., ..., 0., 0., 0.], [0., 0., 0., ..., 0., 0., 0.], ..., [0., 0., 0., ..., 0., 0., 0.], [0., 0., 0., ..., 0., 0., 0.], [0., 0., 0., ..., 0., 0., 0.]]) - REGION_MASK(nlat, nlon)float640.0 0.0 0.0 0.0 ... 0.0 0.0 0.0 0.0
array([[0., 0., 0., ..., 0., 0., 0.], [0., 0., 0., ..., 0., 0., 0.], [0., 0., 0., ..., 0., 0., 0.], ..., [0., 0., 0., ..., 0., 0., 0.], [0., 0., 0., ..., 0., 0., 0.], [0., 0., 0., ..., 0., 0., 0.]]) - fgco2_obs(nlat, nlon)float64nan nan nan nan ... nan nan nan nan
array([[nan, nan, nan, ..., nan, nan, nan],
       [nan, nan, nan, ..., nan, nan, nan],
       [nan, nan, nan, ..., nan, nan, nan],
       ...,
       [nan, nan, nan, ..., nan, nan, nan],
       [nan, nan, nan, ..., nan, nan, nan],
       [nan, nan, nan, ..., nan, nan, nan]])
fig = plt.figure(figsize=(12, 6))
prj = ccrs.Robinson(central_longitude=305.0)

gs = gridspec.GridSpec(
    nrows=2, ncols=6,
    width_ratios=(1, 0.01, 0.3, 0.3, 0.25, 0.02),
    wspace=0.1,
    hspace=0.15,
)

axs = np.empty((2, 6)).astype(object)

axs_map = [
    plt.subplot(gs[0, 0], projection=prj),
    plt.subplot(gs[1, 0], projection=prj),
]
cax = plt.subplot(gs[:, -1])

axs_za = [
    plt.subplot(gs[:, 2]),
    plt.subplot(gs[:, 3]),
]

ax_za_mean = plt.subplot(gs[:, 4])

cmap = cmocean.cm.balance

levels = np.arange(-3.6, 3.8, 0.2)

for field, ax in zip(['fgco2', 'fgco2_obs'], axs_map):

    cf = ax.contourf(
        dsa.TLONG, dsa.TLAT, dsa[field],
        levels=levels,
        extend='both',
        cmap=cmap,
        norm=colors.BoundaryNorm(levels, ncolors=cmap.N),
        transform=ccrs.PlateCarree(),
    )

    land = ax.add_feature(
        cartopy.feature.NaturalEarthFeature(
            'physical','land','110m',
            edgecolor='face',
            facecolor='gray'
        )
    )


axs_map[0].set_title(f'CESM: {ds_glb.FG_CO2.values[0]:0.2f} Pg C yr$^{{-1}}$')
axs_map[1].set_title(f'SOM-FFN: {ds_obs_glb.values[0]:0.2f} Pg C yr$^{{-1}}$')

axs_za[0].pcolormesh(
    np.arange(0, 13, 1),
    ds_za.lat_t_edges,
    ds_za.FG_CO2.isel(basins=0).T,
    cmap=cmap,
    norm=colors.BoundaryNorm(levels, ncolors=cmap.N),
)

axs_za[1].pcolormesh(
    np.arange(0, 13, 1),
    ds_obs_za.lat,
    ds_obs_za.fgco2_smoothed.T,
    cmap=cmap,
    norm=colors.BoundaryNorm(levels, ncolors=cmap.N),
)

ax_za_mean.plot(ds_za.FG_CO2.isel(basins=0).mean('time'), ds_za.lat_t, '-', color='tab:blue', label='CESM2')
ax_za_mean.plot(ds_obs_za.fgco2_smoothed.mean('time'), ds_obs_za.lat, '-', color='tab:red', label='SOM-FFN')

monlabs = np.array(["J", "F", "M", "A", "M", "J", "J", "A", "S", "O", "N", "D"])

for ax in axs_za:
    ax.set_ylim([-80, 90.])
    ax.set_yticks(np.arange(-75, 90, 15))
    ax.set_xticks(np.arange(0, 13))
    ax.set_xticklabels([f'   {m}' for m in monlabs]+['']);
axs_za[0].set_ylabel('Latitude [°N]')
axs_za[1].set_yticklabels([])

axs_za[0].set_title('CESM')
axs_za[1].set_title('SOM-FFN')

ax_za_mean.set_ylim([-80, 90.])
ax_za_mean.set_yticks(np.arange(-75, 90, 15))
ax_za_mean.set_yticklabels([])
ax_za_mean.set_xticks(np.arange(-2.5, 1.5, 0.5))
ax_za_mean.set_xticklabels(['', '-2', '', -1, '', '0', '', '1'])
ax_za_mean.axvline(0., linewidth=0.5, color='k',)
ax_za_mean.set_xlabel('mol m$^{-2}$ yr$^{-1}$')

ax_za_mean.legend(loc=(0.03, 0.45), frameon=False, handlelength=1.0, fontsize=8, handletextpad=0.5)

utils.label_plots(fig, [ax for ax in axs_map], xoff=0.02, yoff=0)
utils.label_plots(fig, [ax for ax in axs_za + [ax_za_mean]], xoff=-0.01, start=2)

plt.colorbar(cf, cax=cax)
cax.set_title('mol m$^{-2}$ yr$^{-1}$')

utils.savefig('fgco2.pdf')
/glade/u/home/mgrover/miniconda3/envs/cesm2-marbl/lib/python3.7/site-packages/ipykernel_launcher.py:66: MatplotlibDeprecationWarning: shading='flat' when X and Y have the same dimensions as C is deprecated since 3.3. Either specify the corners of the quadrilaterals with X and Y, or pass shading='auto', 'nearest' or 'gouraud', or set rcParams['pcolor.shading']. This will become an error two minor releases later.