Biological Pump
Imports
%load_ext autoreload
%autoreload 2
The autoreload extension is already loaded. To reload it, use:
  %reload_ext autoreload
import os

from itertools import product

import numpy as np
import xarray as xr
import intake

import matplotlib.pyplot as plt
import matplotlib.gridspec as gridspec
import matplotlib.colors as colors
import cmocean

import cartopy
import cartopy.crs as ccrs


import xpersist as xp
cache_dir = '/glade/p/cgd/oce/projects/cesm2-marbl/xpersist_cache/3d_fields'
if (os.path.isdir(cache_dir)):
    xp.settings['cache_dir'] = cache_dir
os.makedirs(cache_dir, exist_ok=True)

import pop_tools

import climo_utils as cu
import plot
import utils
%matplotlib inline
Spin up a Dask Cluster
cluster, client = utils.get_ClusterClient()
cluster.scale(12) #adapt(minimum_jobs=0, maximum_jobs=24)
client
Client
|
Cluster
|
Read in the Data
catalog = intake.open_esm_datastore('data/campaign-cesm2-cmip6-timeseries.json')
df = catalog.search(experiment='historical', component='ocn', stream='pop.h').df
variables = df.variable.unique()
[v for v in variables if 'CaCO3' in v]
['CaCO3_FLUX_100m',
 'CaCO3_PROD_zint',
 'CaCO3_PROD_zint_100m',
 'CaCO3_REMIN_zint',
 'CaCO3_REMIN_zint_100m',
 'CaCO3_form_zint',
 'CaCO3_form_zint_100m',
 'spCaCO3']
Read in the Grid from Pop-Tools
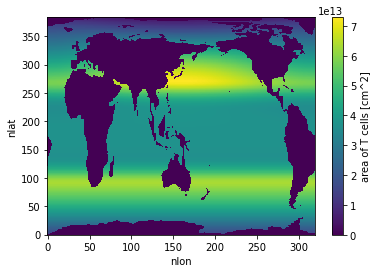
grid = pop_tools.get_grid('POP_gx1v7')
masked_area = grid.TAREA.where(grid.REGION_MASK > 0).fillna(0.)
masked_area.plot()
<matplotlib.collections.QuadMesh at 0x2b3fd7e44c50>
Apply Computation, Cache Using xpersist
nmolcm2s_to_molm2yr = 1e-9 * 1e4 * 86400 * 365.
nmols_to_PgCyr = 1e-9 * 12. * 1e-15 * 86400 * 365.
nmols_to_TmolSiyr = 1e-9 * 1e-12 * 86400 * 365.
time_slice = slice("1990-01-15", "2015-01-15")
varlist = [
'photoC_TOT_zint_100m',
'Jint_100m_DIC',
'POC_FLUX_100m',
'POP_FLUX_100m',
'SiO2_FLUX_100m',
'CaCO3_FLUX_100m',
]
ds_list = []
for variable in varlist:
xp_func = xp.persist_ds(cu.read_CESM_var, name=f'{variable}', trust_cache=True)
ds_list.append(xp_func(
time_slice,
variable,
mean_dims=['member_id', 'time'],
))
ds = xr.merge(ds_list)
r_N2C = 16. / 117.
ds['N2P_FLUX_100m'] = ds.POC_FLUX_100m * r_N2C / ds.POP_FLUX_100m
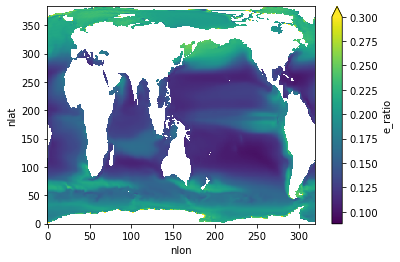
ds['e_ratio'] = ds.POC_FLUX_100m / ds.photoC_TOT_zint_100m
ds_glb = xr.Dataset()
convert_glb = dict(
photoC_TOT_zint_100m=dict(scale_factor=nmols_to_PgCyr, units='Pg C yr$^{-1}$'),
POC_FLUX_100m=dict(scale_factor=nmols_to_PgCyr, units='Pg C yr$^{-1}$'),
CaCO3_FLUX_100m=dict(scale_factor=nmols_to_PgCyr, units='Pg C yr$^{-1}$'),
SiO2_FLUX_100m=dict(scale_factor=nmols_to_TmolSiyr, units='Tmol Si yr$^{-1}$'),
)
for v in varlist:
assert ds[v].attrs['units'] == 'mmol/m^3 cm/s'
assert ds[v].dims == ('nlat', 'nlon')
if v in convert_glb:
ds_glb[v] = (masked_area * ds[v]).sum() * convert_glb[v]['scale_factor']
ds_glb[v].attrs['units'] = convert_glb[v]['units']
ds[v] = ds[v] * nmolcm2s_to_molm2yr
ds[v].attrs['units'] = 'mol m$^{-2}$ yr$^{-1}$'
for v in ['N2P_FLUX_100m', 'e_ratio']:
ds_glb[v] = (masked_area * ds[v]).sum() / masked_area.sum()
ds_glb['N2P_FLUX_100m'].attrs['units'] = 'mol N:mol P'
ds_glb['e_ratio'].attrs['units'] = ''
ds
assuming cache is correct
reading cached file: /glade/p/cgd/oce/projects/cesm2-marbl/xpersist_cache/3d_fields/photoC_TOT_zint_100m.nc
assuming cache is correct
reading cached file: /glade/p/cgd/oce/projects/cesm2-marbl/xpersist_cache/3d_fields/Jint_100m_DIC.nc
assuming cache is correct
reading cached file: /glade/p/cgd/oce/projects/cesm2-marbl/xpersist_cache/3d_fields/POC_FLUX_100m.nc
assuming cache is correct
reading cached file: /glade/p/cgd/oce/projects/cesm2-marbl/xpersist_cache/3d_fields/POP_FLUX_100m.nc
assuming cache is correct
reading cached file: /glade/p/cgd/oce/projects/cesm2-marbl/xpersist_cache/3d_fields/SiO2_FLUX_100m.nc
assuming cache is correct
reading cached file: /glade/p/cgd/oce/projects/cesm2-marbl/xpersist_cache/3d_fields/CaCO3_FLUX_100m.nc
<xarray.Dataset>
Dimensions:               (nlat: 384, nlon: 320)
Coordinates:
    TLONG                 (nlat, nlon) float64 320.6 321.7 322.8 ... 319.4 319.8
    TLAT                  (nlat, nlon) float64 -79.22 -79.22 ... 72.19 72.19
    ULONG                 (nlat, nlon) float64 321.1 322.3 323.4 ... 319.6 320.0
    ULAT                  (nlat, nlon) float64 -78.95 -78.95 ... 72.41 72.41
Dimensions without coordinates: nlat, nlon
Data variables:
    photoC_TOT_zint_100m  (nlat, nlon) float32 nan nan nan nan ... nan nan nan
    Jint_100m_DIC         (nlat, nlon) float32 nan nan nan nan ... nan nan nan
    POC_FLUX_100m         (nlat, nlon) float32 nan nan nan nan ... nan nan nan
    POP_FLUX_100m         (nlat, nlon) float32 nan nan nan nan ... nan nan nan
    SiO2_FLUX_100m        (nlat, nlon) float32 nan nan nan nan ... nan nan nan
    CaCO3_FLUX_100m       (nlat, nlon) float32 nan nan nan nan ... nan nan nan
    N2P_FLUX_100m         (nlat, nlon) float32 nan nan nan nan ... nan nan nan
    e_ratio               (nlat, nlon) float32 nan nan nan nan ... nan nan nan
Attributes:
    time_period_freq:        month_1
    history:                 none
    cell_methods:            cell_methods = time: mean ==> the variable value...
    title:                   b.e21.BHIST.f09_g17.CMIP6-historical.011
    model_doi_url:           https://doi.org/10.5065/D67H1H0V
    Conventions:             CF-1.0; http://www.cgd.ucar.edu/cms/eaton/netcdf...
    calendar:                All years have exactly  365 days.
    revision:                $Id: tavg.F90 89644 2018-08-04 14:26:01Z klindsay $
    intake_esm_varname:      photoC_TOT_zint_100m
    contents:                Diagnostic and Prognostic Variables
    source:                  CCSM POP2, the CCSM Ocean Component
    intake_esm_dataset_key:  ocn.historical.pop.h
xarray.Dataset
- nlat: 384
- nlon: 320
- TLONG(nlat, nlon)float64320.6 321.7 322.8 ... 319.4 319.8
- long_name :
- array of t-grid longitudes
- units :
- degrees_east
array([[320.56250892, 321.68750895, 322.81250898, ..., 317.18750883, 318.31250886, 319.43750889], [320.56250892, 321.68750895, 322.81250898, ..., 317.18750883, 318.31250886, 319.43750889], [320.56250892, 321.68750895, 322.81250898, ..., 317.18750883, 318.31250886, 319.43750889], ..., [320.25133086, 320.75380113, 321.25577325, ..., 318.74424456, 319.24621668, 319.74869143], [320.23459477, 320.70358949, 321.17207442, ..., 318.82794339, 319.29642832, 319.76542721], [320.21650899, 320.6493303 , 321.08163473, ..., 318.91838308, 319.3506875 , 319.78351267]]) - TLAT(nlat, nlon)float64-79.22 -79.22 ... 72.19 72.19
- long_name :
- array of t-grid latitudes
- units :
- degrees_north
array([[-79.22052261, -79.22052261, -79.22052261, ..., -79.22052261, -79.22052261, -79.22052261], [-78.68630626, -78.68630626, -78.68630626, ..., -78.68630626, -78.68630626, -78.68630626], [-78.15208992, -78.15208992, -78.15208992, ..., -78.15208992, -78.15208992, -78.15208992], ..., [ 71.29031715, 71.29408252, 71.30160692, ..., 71.30160692, 71.29408252, 71.29031716], [ 71.73524335, 71.73881845, 71.74596231, ..., 71.74596231, 71.73881845, 71.73524335], [ 72.18597561, 72.18933231, 72.19603941, ..., 72.19603941, 72.18933231, 72.18597562]]) - ULONG(nlat, nlon)float64321.1 322.3 323.4 ... 319.6 320.0
- long_name :
- array of u-grid longitudes
- units :
- degrees_east
array([[321.12500894, 322.25000897, 323.375009 , ..., 317.75000884, 318.87500887, 320.0000089 ], [321.12500894, 322.25000897, 323.375009 , ..., 317.75000884, 318.87500887, 320.0000089 ], [321.12500894, 322.25000897, 323.375009 , ..., 317.75000884, 318.87500887, 320.0000089 ], ..., [320.48637802, 320.97240884, 321.4577638 , ..., 319.02760897, 319.51363979, 320.00001324], [320.45160767, 320.90286181, 321.35342745, ..., 319.097156 , 319.54841014, 320.00001293], [320.41397858, 320.82760085, 321.24052915, ..., 319.17241696, 319.58603923, 320.00001259]]) - ULAT(nlat, nlon)float64-78.95 -78.95 ... 72.41 72.41
- long_name :
- array of u-grid latitudes
- units :
- degrees_north
array([[-78.95289509, -78.95289509, -78.95289509, ..., -78.95289509,
        -78.95289509, -78.95289509],
       [-78.41865507, -78.41865507, -78.41865507, ..., -78.41865507,
        -78.41865507, -78.41865507],
       [-77.88441506, -77.88441506, -77.88441506, ..., -77.88441506,
        -77.88441506, -77.88441506],
       ...,
       [ 71.51215224,  71.51766482,  71.52684191, ...,  71.51766482,
         71.51215224,  71.51031365],
       [ 71.95983548,  71.96504258,  71.97371054, ...,  71.96504258,
         71.95983548,  71.95809872],
       [ 72.4135549 ,  72.41841155,  72.42649554, ...,  72.41841155,
         72.4135549 ,  72.41193498]])
- photoC_TOT_zint_100m(nlat, nlon)float32nan nan nan nan ... nan nan nan nan
- units :
- mol m$^{-2}$ yr$^{-1}$
array([[ nan, nan, nan, ..., nan, nan, nan], [ nan, nan, nan, ..., nan, nan, nan], [0.0091126 , 0.01107335, 0.00905102, ..., nan, nan, nan], ..., [ nan, nan, nan, ..., nan, nan, nan], [ nan, nan, nan, ..., nan, nan, nan], [ nan, nan, nan, ..., nan, nan, nan]], dtype=float32) - Jint_100m_DIC(nlat, nlon)float32nan nan nan nan ... nan nan nan nan
- units :
- mol m$^{-2}$ yr$^{-1}$
array([[ nan, nan, nan, ..., nan, nan, nan], [ nan, nan, nan, ..., nan, nan, nan], [0.21279056, 0.21571355, 0.22301859, ..., nan, nan, nan], ..., [ nan, nan, nan, ..., nan, nan, nan], [ nan, nan, nan, ..., nan, nan, nan], [ nan, nan, nan, ..., nan, nan, nan]], dtype=float32) - POC_FLUX_100m(nlat, nlon)float32nan nan nan nan ... nan nan nan nan
- units :
- mol m$^{-2}$ yr$^{-1}$
array([[ nan, nan, nan, ..., nan, nan, nan], [ nan, nan, nan, ..., nan, nan, nan], [0.02390587, 0.02466184, 0.02558904, ..., nan, nan, nan], ..., [ nan, nan, nan, ..., nan, nan, nan], [ nan, nan, nan, ..., nan, nan, nan], [ nan, nan, nan, ..., nan, nan, nan]], dtype=float32) - POP_FLUX_100m(nlat, nlon)float32nan nan nan nan ... nan nan nan nan
- units :
- mol m$^{-2}$ yr$^{-1}$
array([[ nan, nan, nan, ..., nan, nan, nan], [ nan, nan, nan, ..., nan, nan, nan], [0.00020432, 0.00021079, 0.00021871, ..., nan, nan, nan], ..., [ nan, nan, nan, ..., nan, nan, nan], [ nan, nan, nan, ..., nan, nan, nan], [ nan, nan, nan, ..., nan, nan, nan]], dtype=float32) - SiO2_FLUX_100m(nlat, nlon)float32nan nan nan nan ... nan nan nan nan
- units :
- mol m$^{-2}$ yr$^{-1}$
array([[ nan, nan, nan, ..., nan, nan, nan], [ nan, nan, nan, ..., nan, nan, nan], [0.00717082, 0.00710713, 0.00710576, ..., nan, nan, nan], ..., [ nan, nan, nan, ..., nan, nan, nan], [ nan, nan, nan, ..., nan, nan, nan], [ nan, nan, nan, ..., nan, nan, nan]], dtype=float32) - CaCO3_FLUX_100m(nlat, nlon)float32nan nan nan nan ... nan nan nan nan
- units :
- mol m$^{-2}$ yr$^{-1}$
array([[ nan, nan, nan, ..., nan, nan, nan], [ nan, nan, nan, ..., nan, nan, nan], [0.00068615, 0.00073934, 0.00079527, ..., nan, nan, nan], ..., [ nan, nan, nan, ..., nan, nan, nan], [ nan, nan, nan, ..., nan, nan, nan], [ nan, nan, nan, ..., nan, nan, nan]], dtype=float32) - N2P_FLUX_100m(nlat, nlon)float32nan nan nan nan ... nan nan nan nan
array([[ nan, nan, nan, ..., nan, nan, nan], [ nan, nan, nan, ..., nan, nan, nan], [15.999999, 15.999997, 15.999997, ..., nan, nan, nan], ..., [ nan, nan, nan, ..., nan, nan, nan], [ nan, nan, nan, ..., nan, nan, nan], [ nan, nan, nan, ..., nan, nan, nan]], dtype=float32) - e_ratio(nlat, nlon)float32nan nan nan nan ... nan nan nan nan
array([[      nan,       nan,       nan, ...,       nan,       nan,
              nan],
       [      nan,       nan,       nan, ...,       nan,       nan,
              nan],
       [2.623385 , 2.2271342, 2.827199 , ...,       nan,       nan,
              nan],
       ...,
       [      nan,       nan,       nan, ...,       nan,       nan,
              nan],
       [      nan,       nan,       nan, ...,       nan,       nan,
              nan],
       [      nan,       nan,       nan, ...,       nan,       nan,
              nan]], dtype=float32)
- time_period_freq :
- month_1
- history :
- none
- cell_methods :
- cell_methods = time: mean ==> the variable values are averaged over the time interval between the previous time coordinate and the current one. cell_methods absent ==> the variable values are at the time given by the current time coordinate.
- title :
- b.e21.BHIST.f09_g17.CMIP6-historical.011
- model_doi_url :
- https://doi.org/10.5065/D67H1H0V
- Conventions :
- CF-1.0; http://www.cgd.ucar.edu/cms/eaton/netcdf/CF-current.htm
- calendar :
- All years have exactly 365 days.
- revision :
- $Id: tavg.F90 89644 2018-08-04 14:26:01Z klindsay $
- intake_esm_varname :
- photoC_TOT_zint_100m
- contents :
- Diagnostic and Prognostic Variables
- source :
- CCSM POP2, the CCSM Ocean Component
- intake_esm_dataset_key :
- ocn.historical.pop.h
After Calculation, Spin Down the Cluster
client.close()
cluster.close()
del client
del cluster
Plot the Results
E Ratio
ds.e_ratio.plot(vmax=0.3)
<matplotlib.collections.QuadMesh at 0x2b3fdcabd390>
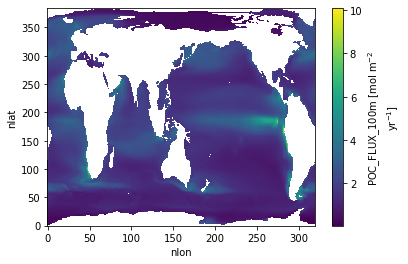
POC Flux 100 m
ds.POC_FLUX_100m.plot()
<matplotlib.collections.QuadMesh at 0x2b3fdd1c72d0>
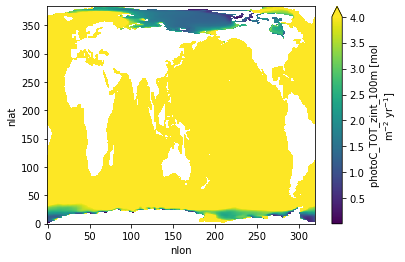
PhotoC TOT Zint 100 m
ds.photoC_TOT_zint_100m.plot(vmax=4.)
<matplotlib.collections.QuadMesh at 0x2b3fdd292710>
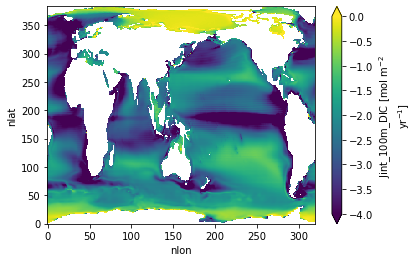
Jint 100 m DIC
ds.Jint_100m_DIC.plot(vmin=-4., vmax=0.)
<matplotlib.collections.QuadMesh at 0x2b3fdd45d3d0>
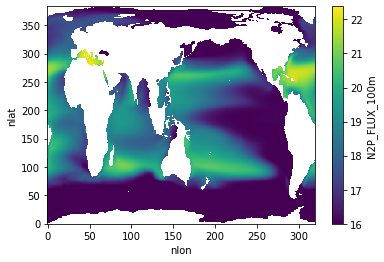
N2P Flux 100 m
ds.N2P_FLUX_100m.plot()
<matplotlib.collections.QuadMesh at 0x2b3fdd54da50>
Add a Cyclic Point to the Dataset
dsp = utils.pop_add_cyclic(ds)
dsp.info()
xarray.Dataset {
dimensions:
	nlat = 384 ;
	nlon = 321 ;

variables:
	float64 TLAT(nlat, nlon) ;
	float64 TLONG(nlat, nlon) ;
	float32 photoC_TOT_zint_100m(nlat, nlon) ;
		photoC_TOT_zint_100m:units = mol m$^{-2}$ yr$^{-1}$ ;
	float32 Jint_100m_DIC(nlat, nlon) ;
		Jint_100m_DIC:units = mol m$^{-2}$ yr$^{-1}$ ;
	float32 POC_FLUX_100m(nlat, nlon) ;
		POC_FLUX_100m:units = mol m$^{-2}$ yr$^{-1}$ ;
	float32 POP_FLUX_100m(nlat, nlon) ;
		POP_FLUX_100m:units = mol m$^{-2}$ yr$^{-1}$ ;
	float32 SiO2_FLUX_100m(nlat, nlon) ;
		SiO2_FLUX_100m:units = mol m$^{-2}$ yr$^{-1}$ ;
	float32 CaCO3_FLUX_100m(nlat, nlon) ;
		CaCO3_FLUX_100m:units = mol m$^{-2}$ yr$^{-1}$ ;
	float32 N2P_FLUX_100m(nlat, nlon) ;
	float32 e_ratio(nlat, nlon) ;

// global attributes:
}
Take a Look at ds_glb which Contains Global Integral Stats
ds_glb
<xarray.Dataset>
Dimensions:               ()
Data variables:
    photoC_TOT_zint_100m  float64 48.38
    POC_FLUX_100m         float64 7.05
    SiO2_FLUX_100m        float64 78.3
    CaCO3_FLUX_100m       float64 0.7677
    N2P_FLUX_100m         float64 17.09
    e_ratio               float64 0.1478
xarray.Dataset
- photoC_TOT_zint_100m()float6448.38
- units :
- Pg C yr$^{-1}$
array(48.37640707)
- POC_FLUX_100m()float647.05
- units :
- Pg C yr$^{-1}$
array(7.05017249)
- SiO2_FLUX_100m()float6478.3
- units :
- Tmol Si yr$^{-1}$
array(78.2992232)
- CaCO3_FLUX_100m()float640.7677
- units :
- Pg C yr$^{-1}$
array(0.76768008)
- N2P_FLUX_100m()float6417.09
- units :
- mol N:mol P
array(17.08596864)
- e_ratio()float640.1478
- units :
array(0.14780106)
We can use these to create titles for our plots
titles = dict(
photoC_TOT_zint_100m=f'NPP: {ds_glb["photoC_TOT_zint_100m"].values:0.1f} {ds_glb["photoC_TOT_zint_100m"].units}',
POC_FLUX_100m=f'POC export (100m): {ds_glb["POC_FLUX_100m"].values:0.1f} {ds_glb["POC_FLUX_100m"].units}',
e_ratio=f'Export ratio: {ds_glb["e_ratio"].values:0.1f}',
N2P_FLUX_100m=f'Export N:P ratio: {ds_glb["N2P_FLUX_100m"].values:0.1f} {ds_glb["N2P_FLUX_100m"].units}',
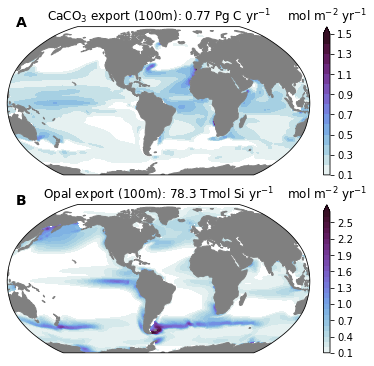
CaCO3_FLUX_100m=f'CaCO$_3$ export (100m): {ds_glb["CaCO3_FLUX_100m"].values:0.2f} {ds_glb["CaCO3_FLUX_100m"].units}',
SiO2_FLUX_100m=f'Opal export (100m): {ds_glb["SiO2_FLUX_100m"].values:0.1f} {ds_glb["SiO2_FLUX_100m"].units}',
)
titles
{'photoC_TOT_zint_100m': 'NPP: 48.4 Pg C yr$^{-1}$',
 'POC_FLUX_100m': 'POC export (100m): 7.1 Pg C yr$^{-1}$',
 'e_ratio': 'Export ratio: 0.1',
 'N2P_FLUX_100m': 'Export N:P ratio: 17.1 mol N:mol P',
 'CaCO3_FLUX_100m': 'CaCO$_3$ export (100m): 0.77 Pg C yr$^{-1}$',
 'SiO2_FLUX_100m': 'Opal export (100m): 78.3 Tmol Si yr$^{-1}$'}
Plot Global Maps with Global Integrals
fig = plt.figure(figsize=(12, 6))
prj = ccrs.Robinson(central_longitude=305.0)

nrow, ncol = 2, 2
gs = gridspec.GridSpec(
    nrows=nrow, ncols=ncol*3,
    width_ratios=(1, 0.02, 0.02)*ncol,
    wspace=0.15,
    hspace=0.1,
)

axs = np.empty((nrow, ncol)).astype(object)
caxs= np.empty((nrow, ncol)).astype(object)
for i, j in product(range(nrow), range(ncol)):
    axs[i, j] = plt.subplot(gs[i, j*3], projection=prj)
    caxs[i, j] = plt.subplot(gs[i, j*3+1])


levels = dict(
    photoC_TOT_zint_100m=[0.5, 1., 2.5, 5., 7.5, 10., 15., 20., 25., 30., 40., 50., 60., 80., 100. ],
    POC_FLUX_100m=np.array([0.5, 1., 2.5, 5., 7.5, 10., 15., 20., 25., 30., 40., 50., 60., 80., 100. ])*0.1,
    e_ratio=np.arange(0.05, 0.35, 0.025),
    N2P_FLUX_100m=np.arange(16., 22., 0.5),
)

cmap_field = cmocean.cm.dense

for n, field in enumerate(['photoC_TOT_zint_100m', 'POC_FLUX_100m', 'e_ratio', 'N2P_FLUX_100m']):

    i, j = np.unravel_index(n, axs.shape)

    ax = axs[i, j]

    cf = ax.contourf(
        dsp.TLONG,dsp.TLAT, dsp[field],
        levels=levels[field],
        extend='both',
        cmap=cmap_field,
        norm=colors.BoundaryNorm(levels[field], ncolors=cmap_field.N),
        transform=ccrs.PlateCarree(),
    )

    land = ax.add_feature(
        cartopy.feature.NaturalEarthFeature(
            'physical','land','110m',
            edgecolor='face',
            facecolor='gray'
        )
    )

    ax.set_title(titles[field]) #dsp[field].attrs['title_str'])

    cb = plt.colorbar(cf, cax=caxs[i, j])
    if 'units' in dsp[field].attrs:
        cb.ax.set_title(dsp[field].attrs['units'])

utils.label_plots(fig, [ax for ax in axs.ravel()], xoff=0.02, yoff=0)
utils.savefig('bio-pump-NPP-Export-e_ratio-N2P.pdf')
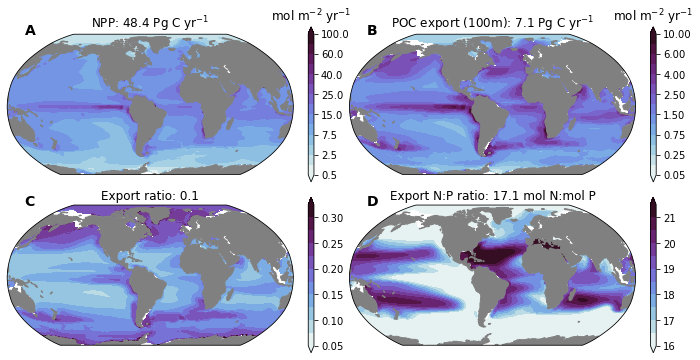
fig = plt.figure(figsize=(6, 6))
prj = ccrs.Robinson(central_longitude=305.0)

nrow, ncol = 2, 1
gs = gridspec.GridSpec(
    nrows=nrow, ncols=ncol+1,
    width_ratios=(1, 0.02)*ncol,
    wspace=0.01,
    hspace=0.2,
)

axs = np.empty((nrow, ncol)).astype(object)
caxs= np.empty((nrow, ncol)).astype(object)
for i, j in product(range(nrow), range(ncol)):
    axs[i, j] = plt.subplot(gs[i, j], projection=prj)
    caxs[i, j] = plt.subplot(gs[i, j+1])


levels = dict(
    CaCO3_FLUX_100m=plot.nice_levels(ds.CaCO3_FLUX_100m),
    SiO2_FLUX_100m=plot.nice_levels(ds.SiO2_FLUX_100m),
)

cmap_field = cmocean.cm.dense

for n, field in enumerate(['CaCO3_FLUX_100m', 'SiO2_FLUX_100m']):

    i, j = np.unravel_index(n, axs.shape)

    ax = axs[i, j]

    cf = ax.contourf(
        dsp.TLONG,dsp.TLAT, dsp[field],
        levels=levels[field],
        extend='max',
        cmap=cmap_field,
        norm=colors.BoundaryNorm(levels[field], ncolors=cmap_field.N),
        transform=ccrs.PlateCarree(),
    )

    land = ax.add_feature(
        cartopy.feature.NaturalEarthFeature(
            'physical','land','110m',
            edgecolor='face',
            facecolor='gray'
        )
    )

    ax.set_title(titles[field]) #dsp[field].attrs['title_str'])

    cb = plt.colorbar(cf, cax=caxs[i, j])
    if 'units' in dsp[field].attrs:
        cb.ax.set_title(dsp[field].attrs['units'])

utils.label_plots(fig, [ax for ax in axs.ravel()], xoff=0.02, yoff=0)
utils.savefig('bio-pump-CaCO2-SiO2.pdf')