Comparing with matlab Baselines#
This code is ported from matlab scripts.
Before adding features, we tested a variety of simulations to ensure answers are close (typically within round-off) of the matlab solutions.
First we ran a test case with 9 columns and analytic forcing fields, that can be run with matlab_script = 'test_case'.
Next we read in forcing for three locations from netCDF files; that test can be run with matlab_script = 'test_locs3'.
Finally, we read in forcing from the CESM FOSI run.
For exact reproduction, that test can be run with matlab_script = 'FOSI_cesm_daily'.
Additional Improvements#
After verifying we could reproduce the matlab solutions with daily forcing, we then added the ability to interpolate from monthly forcing.
We also modified how the interpolation is done:
We kept the dates from the CESM FOSI simulation, rather than assuming the output was evenly spaced 30 days apart each year
We apply a floor of 0 for the zooplankton mortality, rather than using the minimum value over the calendar year
We do not extrapolate prior to the first level or after the last time level; instead, we use the first or last level, respectively.
Due to these changes, running matlab_script = 'FOSI_cesm' will not be within round-off of the matlab runs.
Similarly, matlab_script = 'FOSI_cesm_spinup' uses cyclic forcing from the first year but with the above changes to interpolation so the resulting initial conditions will not match the matlab output.
Running the model#
Setup a feisty integration.
%load_ext autoreload
%autoreload 2
import dask
import matplotlib.pyplot as plt
import numpy as np
import xarray as xr
import yaml
from dask.distributed import Client
from dask_jobqueue import PBSCluster
from utils import compare_nc, default_config, old_settings

import feisty
Configure run#
There are a few options on how to run:
test_caseuses an idealized testcase where forcing and depth are computed analyticallytest_locs3is a simple model where three columns were pulled from a larger run for quick testingFOSI_spinupcycles through the first year of 68 years of forcing generated from a CESM; its purpose is to provide equilibriated initial conditionsFOSI_cesmuses initial conditions fromFOSI_spinupbut the full 68 years of forcing from CESM to allow biomass to evolve
Note that both of the FOSI options run on the 85813 active ocean cells from the POP gx1v7 grid.
# matlab_script = 'test_case'
matlab_script = 'test_locs3'
# matlab_script = 'FOSI_spinup'
# matlab_script = 'FOSI_cesm'
# Configuration settings for the offline driver as well as output generated in this notebook
driver_config = default_config()

# configurations that differ from default
driver_config['test_case']['ignore_year_in_forcing'] = True
driver_config['test_case']['make_err_plots'] = True
driver_config['test_case']['plot_settings']['ylim'] = [1e-6, 1]

driver_config['test_locs3']['ignore_year_in_forcing'] = True
driver_config['test_locs3']['end_date'] = '0002-12-31'
driver_config['test_locs3']['max_output_time_dim'] = 730
driver_config['test_locs3']['make_err_plots'] = True
driver_config['test_locs3']['plot_settings']['ylim'] = [1e-6, 100]

driver_config['FOSI_spinup']['ignore_year_in_forcing'] = True
driver_config['FOSI_cesm']['end_date'] = '0251-12-31'
driver_config['FOSI_spinup']['end_date'] = '0100-12-31'
for matlab_script_loc in ['FOSI_cesm', 'FOSI_cesm_daily', 'FOSI_spinup']:
    driver_config[matlab_script_loc]['num_chunks'] = 18
    driver_config[matlab_script_loc]['baseline'] = 'FOSI_cesm.nc'
    driver_config[matlab_script_loc]['baseline_compare'] = False
    if matlab_script_loc != 'FOSI_spinup':
        driver_config[matlab_script_loc]['start_date'] = '0249-01-01'
        driver_config[matlab_script_loc]['make_err_plots'] = True
    driver_config[matlab_script_loc]['compare_forcing'] = False
    # diagnostic_names=driver_config[matlab_script_loc]['diagnostic_names'] = ['growth_rate']
    driver_config[matlab_script_loc]['plot_settings']['X'] = 55000  # looks good
    # driver_config[matlab_script_loc]['plot_settings']['X'] = 15633  # large error in small classes
    # driver_config[matlab_script_loc]['plot_settings']['X'] = 11677  # large error in medium classes
    # driver_config[matlab_script_loc]['plot_settings']['X'] = 76989  # large error in benthic

for matlab_script_loc in ['test_case', 'test_locs3']:
    driver_config[matlab_script_loc]['settings_in'] = old_settings()
baselines_from_nc = xr.open_dataset(
    f'../matlab_baselines/{driver_config[matlab_script]["baseline"]}'
)

# Set negative forcing values to zero
if driver_config[matlab_script]['force_nonnegative']:
    for var in ['poc_flux_bottom', 'zooC', 'zoo_mort']:
        baselines_from_nc[var].data = np.where(
            baselines_from_nc[var].data > 0, baselines_from_nc[var].data, 0
        )

if matlab_script not in driver_config:
    raise ValueError(f"unknown matlab_script '{matlab_script}'")
Set up Dask cluster (if chunking data)#
if driver_config[matlab_script]['num_chunks'] > 1:
    ncores = np.minimum(driver_config[matlab_script]['num_chunks'], 36)
    dask.config.set({'distributed.dashboard.link': '/proxy/{port}/status'})
    # dask.config.set({"distributed.comm.timeouts.tcp": "180s"})
    # dask.config.set({"distributed.comm.timeouts.connect": "180s"})
    cluster = PBSCluster(
        memory='300 GB',
        processes=ncores,
        cores=ncores,
        queue='casper',
        walltime='1:00:00',
        resource_spec='select=1:ncpus=36:mem=300GB',
    )

    cluster.scale(1)
    client = Client(cluster)
else:
    client = None
client
Run the model#
%%time

print(f'Configuring and running {matlab_script}...')

if matlab_script == 'test_case':
    ds_out = feisty.config_and_run_testcase(
        'tanh_shelf',
        'cyclic',
        end_date=driver_config[matlab_script]['end_date'],
        settings_in=driver_config[matlab_script]['settings_in'],
        max_output_time_dim=driver_config[matlab_script]['max_output_time_dim'],
    )
else:
    ds_out = feisty.config_and_run_from_netcdf(
        './forcing.yaml',
        matlab_script,
        start_date=driver_config[matlab_script]['start_date'],
        end_date=driver_config[matlab_script]['end_date'],
        ignore_year_in_forcing=driver_config[matlab_script]['ignore_year_in_forcing'],
        settings_in=driver_config[matlab_script]['settings_in'],
        diagnostic_names=driver_config[matlab_script]['diagnostic_names'],
        max_output_time_dim=driver_config[matlab_script]['max_output_time_dim'],
        num_chunks=driver_config[matlab_script]['num_chunks'],
    )
Configuring and running test_locs3...
Starting forcing dataset generation at 09:56:16
Starting template generation at 09:56:16
Starting run() at 09:56:16
Integrating 730 steps (starting at 09:56:16)
Finished _solve at 09:56:35
CPU times: user 18 s, sys: 195 ms, total: 18.2 s
Wall time: 19.2 s
if driver_config[matlab_script]['baseline_compare']:
    compare_nc(baselines_from_nc, ds_out["biomass"], thres=1e-15)
| group | Matlab Value | Python Value | Rel Err |
| --- | --- | --- | --- |
| Sf (t=0002-02-09 00:00:00, X=280.5) | 3.0534e-05 | 3.0534e-05 | 2.2193e-16 |
| Sp (t=0001-01-01 00:00:00, X=195.5) | 9.9989e-06 | 9.9989e-06 | 0.0000e+00 |
| Sd (t=0002-12-08 00:00:00, X=202.5) | 8.7526e-06 | 8.7526e-06 | 1.9355e-16 |
| Mf (t=0001-03-03 00:00:00, X=195.5) | 4.1794e-05 | 4.1794e-05 | 3.2427e-16 |
| Mp (t=0001-04-20 00:00:00, X=280.5) | 1.4277e-04 | 1.4277e-04 | 3.7971e-16 |
| Md (t=0001-01-05 00:00:00, X=280.5) | 1.5650e-05 | 1.5650e-05 | 2.1649e-16 |
| Lp (t=0002-03-06 00:00:00, X=280.5) | 9.9276e-04 | 9.9276e-04 | 6.5526e-16 |
| Ld (t=0001-08-03 00:00:00, X=202.5) | 2.0739e-05 | 2.0739e-05 | 1.6337e-15 |
| benthic_prey (t=0002-01-06 00:00:00, X=202.5) | 3.3466e-01 | 3.3466e-01 | 1.9905e-15 |
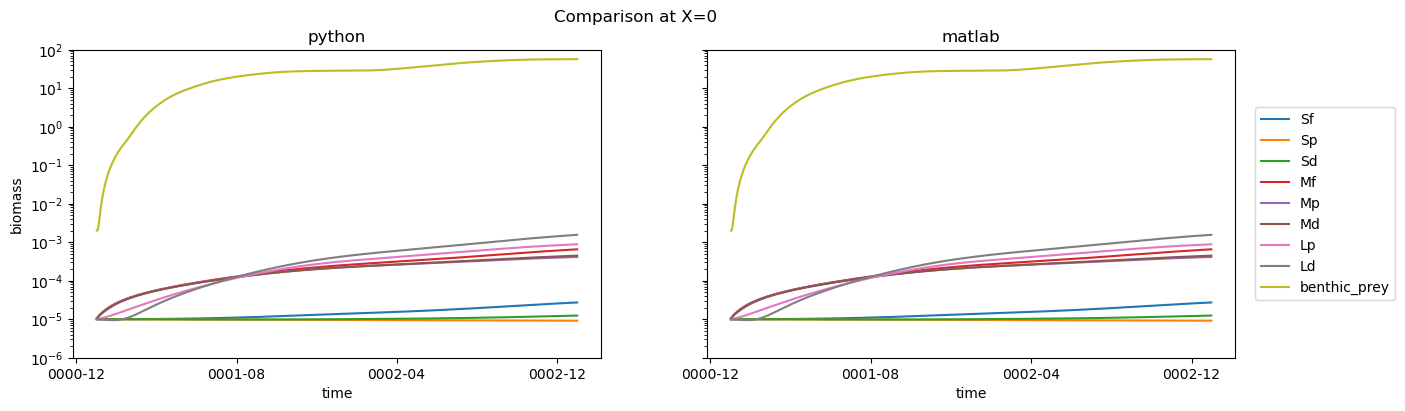
if driver_config[matlab_script]['make_plots']:
    if len(baselines_from_nc.time) > len(ds_out.time):
        isel_dict = {"time": range(len(ds_out.time))}
        baselines_tmp = baselines_from_nc.isel(isel_dict).assign_coords(
            {'group': ds_out.group.data, 'time': ds_out.time.data}
        )
    else:
        baselines_tmp = baselines_from_nc.assign_coords({'group': ds_out.group.data})
    fig, axs = plt.subplots(1, 2, figsize=(15, 4))
    for group in ds_out.group.data:
        ds_out.biomass.sel(group=group).isel(
            X=driver_config[matlab_script]['plot_settings']['X']
        ).plot(ax=axs[0])
        baselines_tmp.biomass.sel(group=group).isel(
            X=driver_config[matlab_script]['plot_settings']['X']
        ).plot(ax=axs[1])
    for ax in axs:
        ax.set_ylim(driver_config[matlab_script]['plot_settings']['ylim'])
        ax.set_yscale("log")
    axs[0].set_title("python")
    axs[1].set_title("matlab")
    axs[1].set_ylabel("")
    axs[1].set_yticklabels("")
    plt.legend(ds_out.group.data, bbox_to_anchor=(1.025, 0.5), loc=6)
    fig.suptitle(f"Comparison at X={driver_config[matlab_script]['plot_settings']['X']}")
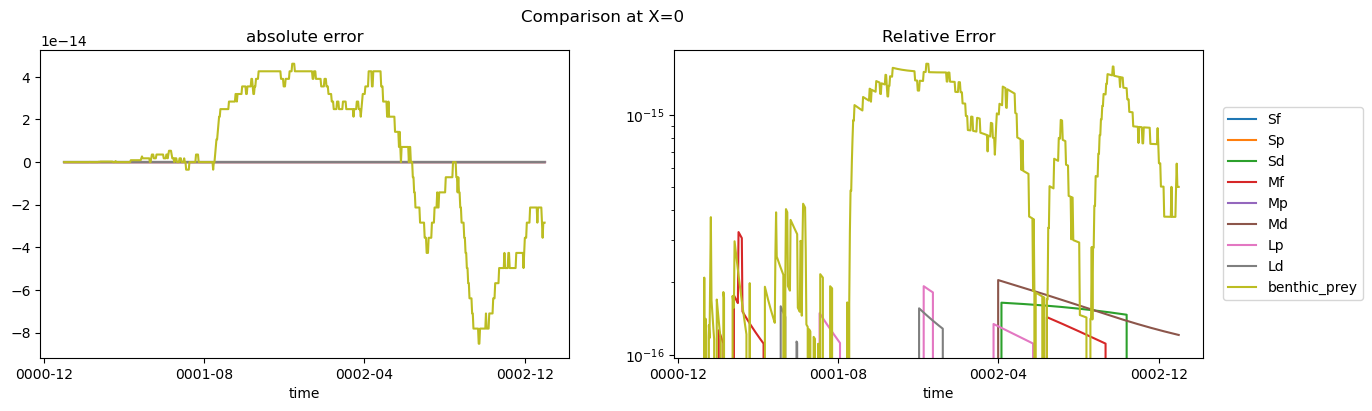
if driver_config[matlab_script]['make_err_plots']:
    fig, axs = plt.subplots(1, 2, figsize=(15, 4))
    for group in ds_out.group.data:
        da1 = ds_out.biomass.sel(group=group).isel(
            X=driver_config[matlab_script]['plot_settings']['X']
        )
        if len(baselines_from_nc.time) < len(ds_out.time):
            da1 = da1.isel({"time": range(len(baselines_from_nc.time))})
        da2 = (
            baselines_tmp.biomass.sel(group=group)
            .isel(X=driver_config[matlab_script]['plot_settings']['X'])
            .assign_coords({'time': da1.time.data})
        )
        (da1 - da2).plot(ax=axs[0])
        (np.abs(da1 - da2) / da2).plot(ax=axs[1])
    axs[0].set_title("absolute error")
    axs[0].set_ylabel("")
    axs[1].set_title("relative error")
    axs[1].set_ylabel("")
    axs[1].set_yscale("log")
    plt.legend(ds_out.group.data, bbox_to_anchor=(1.025, 0.5), loc=6)
    plt.title("Relative Error")
    fig_suptitle = f"Comparison at X={driver_config[matlab_script]['plot_settings']['X']}"
    if len(baselines_from_nc.time) < len(ds_out.time):
        fig_suptitle = f"{fig_suptitle} (time dimension reduced from above)"
    fig.suptitle(fig_suptitle)
if driver_config[matlab_script]['baseline_compare']:
    compare_nc(
        baselines_from_nc.isel(X=[driver_config[matlab_script]['plot_settings']['X']]),
        ds_out["biomass"].isel(X=[driver_config[matlab_script]['plot_settings']['X']]),
        thres=1e-15,
    )
| group | Matlab Value | Python Value | Rel Err |
| --- | --- | --- | --- |
| Sf (t=0001-01-01 00:00:00, X=195.5) | 9.9997e-06 | 9.9997e-06 | 0.0000e+00 |
| Sp (t=0001-01-01 00:00:00, X=195.5) | 9.9989e-06 | 9.9989e-06 | 0.0000e+00 |
| Sd (t=0002-04-06 00:00:00, X=195.5) | 1.0285e-05 | 1.0285e-05 | 1.6472e-16 |
| Mf (t=0001-03-03 00:00:00, X=195.5) | 4.1794e-05 | 4.1794e-05 | 3.2427e-16 |
| Mp (t=0001-01-01 00:00:00, X=195.5) | 1.0541e-05 | 1.0541e-05 | 0.0000e+00 |
| Md (t=0002-04-01 00:00:00, X=195.5) | 2.6491e-04 | 2.6491e-04 | 2.0464e-16 |
| Lp (t=0001-12-09 00:00:00, X=195.5) | 2.8092e-04 | 2.8092e-04 | 1.9298e-16 |
| Ld (t=0001-05-06 00:00:00, X=195.5) | 4.2578e-05 | 4.2578e-05 | 1.5915e-16 |
| benthic_prey (t=0001-12-13 00:00:00, X=195.5) | 2.8330e+01 | 2.8330e+01 | 1.6302e-15 |